29
/
en
AIzaSyAYiBZKx7MnpbEhh9jyipgxe19OcubqV5w
April 1, 2024
104904
Chile
CHL
true
2
1
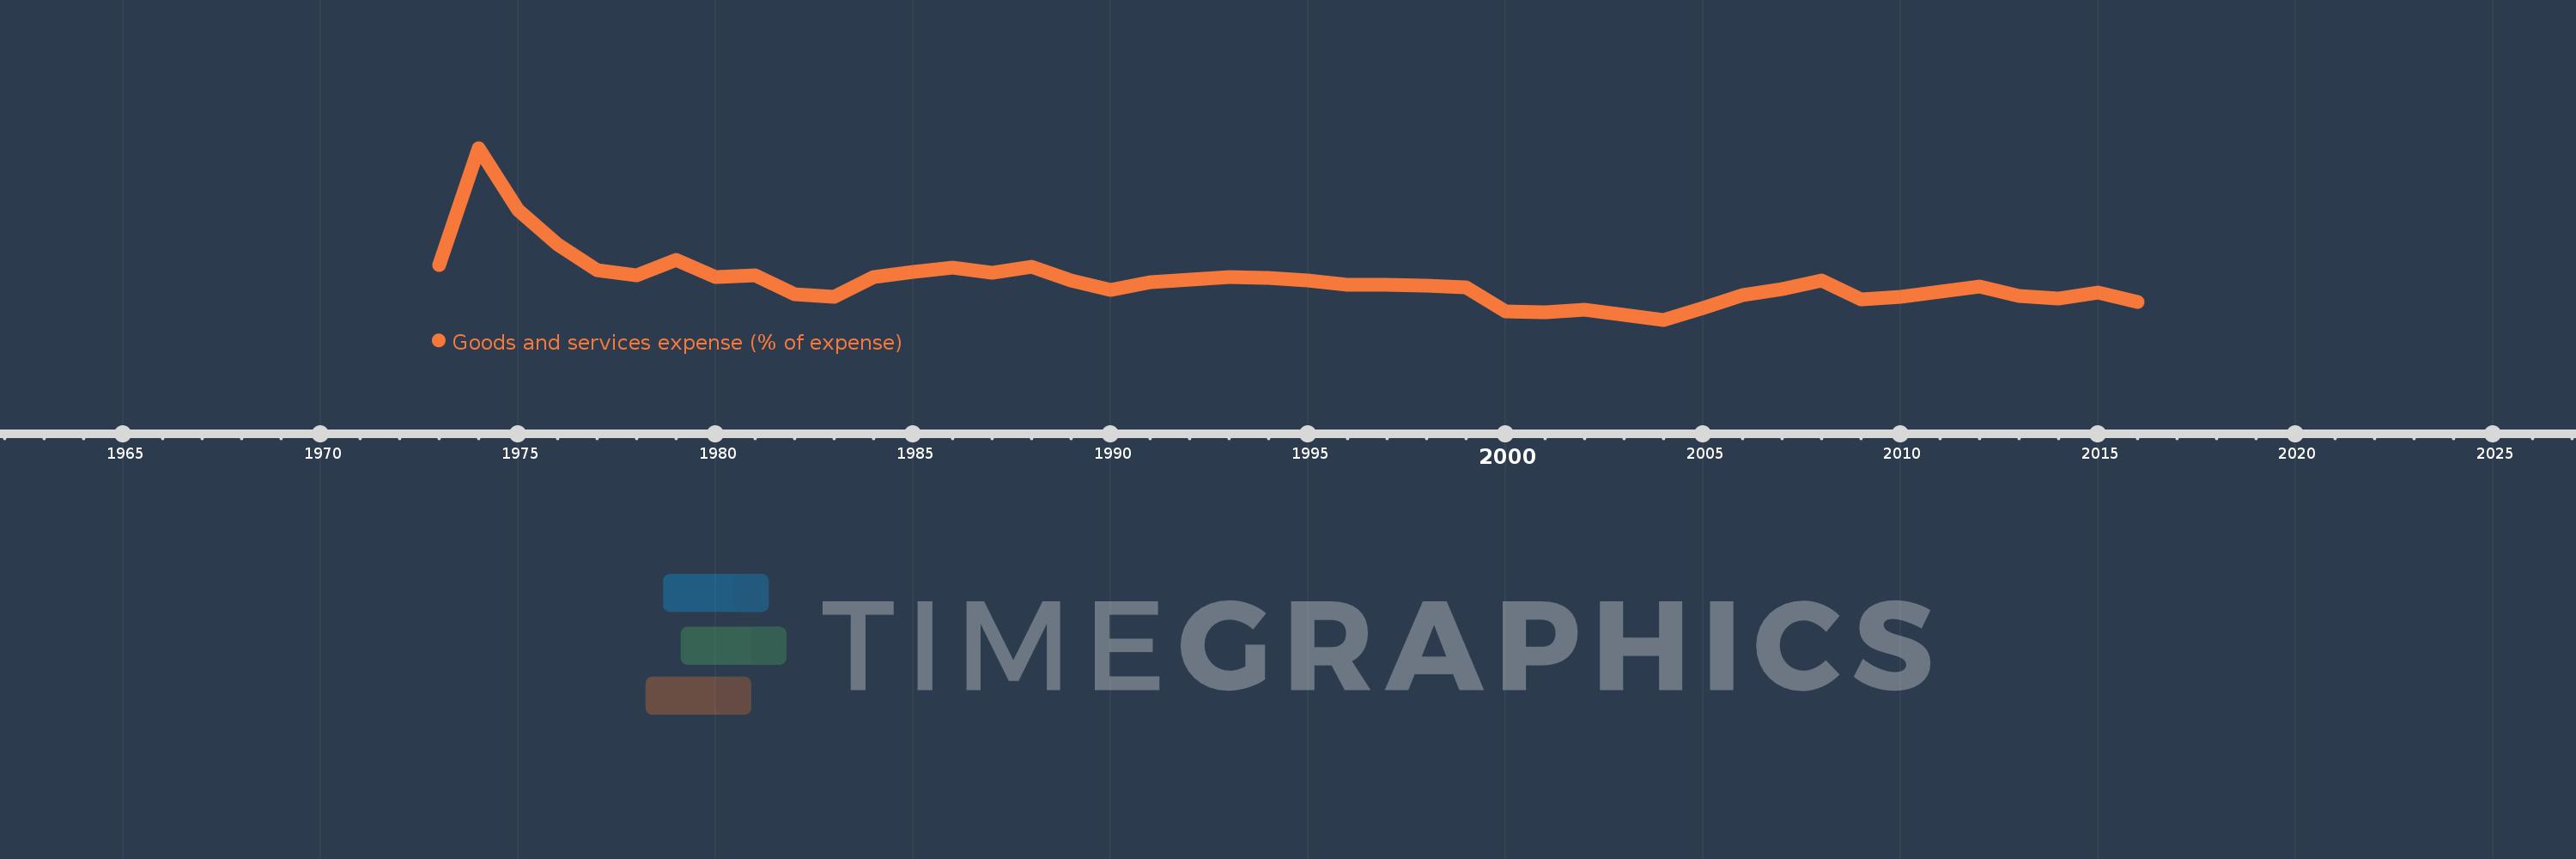
Goods and services expense (% of expense)
2016,2015,2014,2013,2012,2011,2010,2009,2008,2007,2006,2005,2004,2003,2002,2001,2000,1999,1998,1997,1996,1995,1994,1993,1992,1991,1990,1989,1988,1987,1986,1985,1984,1983,1982,1981,1980,1979,1978,1977,1976,1975,1974,1973
This statistics in other country:
AfghanistanAlbaniaAlgeriaAngolaAntigua and BarbudaArab WorldArmeniaAustraliaAustriaAzerbaijanBahamas, TheBahrainBangladeshBarbadosBelarusBelgiumBelizeBeninBhutanBoliviaBosnia and HerzegovinaBotswanaBrazilBulgariaBurkina FasoBurundiCabo VerdeCambodiaCanadaCaribbean small statesCentral African RepublicCentral Europe and the BalticsChileColombiaCongo, Dem. Rep.Congo, Rep.Costa RicaCote d'IvoireCroatiaCyprusCzech RepublicDenmarkDominicaDominican RepublicEarly-demographic dividendEast Asia & PacificEast Asia & Pacific (excluding high income)East Asia & Pacific (IDA & IBRD countries)Egypt, Arab Rep.El SalvadorEquatorial GuineaEstoniaEthiopiaEuro areaEurope & Central AsiaEurope & Central Asia (excluding high income)Europe & Central Asia (IDA & IBRD countries)European UnionFijiFinlandFranceGambia, TheGeorgiaGermanyGhanaGreeceGrenadaGuatemalaHeavily indebted poor countries (HIPC)High incomeHondurasHong Kong SAR, ChinaHungaryIBRD onlyIcelandIDA & IBRD totalIDA blendIDA onlyIDA totalIndiaIndonesiaIran, Islamic Rep.IraqIrelandIsraelItalyJamaicaJapanJordanKazakhstanKenyaKiribatiKorea, Rep.KuwaitKyrgyz RepublicLao PDRLate-demographic dividendLatin America & Caribbean Latin America & Caribbean (excluding high income)Latin America & the Caribbean (IDA & IBRD countries)LatviaLeast developed countries: UN classificationLebanonLesothoLiberiaLithuaniaLow & middle incomeLow incomeLower middle incomeLuxembourgMacao SAR, ChinaMacedonia, FYRMadagascarMalawiMalaysiaMaldivesMaliMaltaMauritiusMexicoMicronesia, Fed. Sts.Middle East & North AfricaMiddle East & North Africa (excluding high income)Middle East & North Africa (IDA & IBRD countries)Middle incomeMoldovaMongoliaMoroccoMozambiqueNamibiaNepalNetherlandsNew ZealandNicaraguaNigeriaNorth AmericaNorwayOECD membersOmanOther small statesPakistanPanamaPapua New GuineaParaguayPeruPhilippinesPolandPortugalPost-demographic dividendPre-demographic dividendQatarRomaniaRussian FederationRwandaSamoaSan MarinoSao Tome and PrincipeSenegalSerbiaSeychellesSierra LeoneSingaporeSlovak RepublicSloveniaSmall statesSolomon IslandsSouth AfricaSouth AsiaSouth Asia (IDA & IBRD)SpainSri LankaSt. Kitts and NevisSt. LuciaSub-Saharan Africa Sub-Saharan Africa (excluding high income)Sub-Saharan Africa (IDA & IBRD countries)SurinameSwazilandSwedenSwitzerlandSyrian Arab RepublicTajikistanTanzaniaThailandTimor-LesteTogoTrinidad and TobagoTunisiaTurkeyUgandaUkraineUnited Arab EmiratesUnited KingdomUnited StatesUpper middle incomeUruguayVanuatuVenezuela, RBWest Bank and GazaWorldYemen, Rep.ZambiaZimbabwe Timeline:
This timeline shows a graph from 1973 to 2016 of Chile. No data until 1972. Number of actual observations by date: 44.
Source name:
World Development Indicators
Source organization:
International Monetary Fund, Government Finance Statistics Yearbook and data files.
Categories, topics:
Public Sector
Last updated:
apr 23, 2017
Indicators value changes by year
Maximum:
21.875
jan 1, 1974
At the date of observation
Value
Absolute change
Change from previous value
jan 1, 1973
12.5
+12.5
0.0%
jan 1, 1974
21.875
+9.375
75.0%
jan 1, 1975
16.883
-4.992
-22.82%
jan 1, 1976
14.176
-2.708
-16.04%
jan 1, 1977
12.125
-2.051
-14.47%
jan 1, 1978
11.657
-0.468
-3.86%
jan 1, 1979
12.932
+1.275
10.94%
jan 1, 1980
11.52
-1.412
-10.92%
jan 1, 1981
11.691
+0.171
1.48%
jan 1, 1982
10.182
-1.509
-12.9%
jan 1, 1983
9.977
-0.205
-2.01%
jan 1, 1984
11.566
+1.588
15.92%
jan 1, 1985
11.941
+0.375
3.24%
jan 1, 1986
12.335
+0.394
3.3%
jan 1, 1987
11.889
-0.446
-3.62%
jan 1, 1988
12.397
+0.508
4.27%
jan 1, 1989
11.247
-1.15
-9.27%
jan 1, 1990
10.507
-0.74
-6.58%
jan 1, 1991
11.161
+0.654
6.23%
jan 1, 1992
11.344
+0.183
1.64%
jan 1, 1993
11.541
+0.197
1.73%
jan 1, 1994
11.497
-0.043
-0.38%
jan 1, 1995
11.295
-0.203
-1.76%
jan 1, 1996
10.935
-0.359
-3.18%
jan 1, 1997
10.948
+0.013
0.12%
jan 1, 1998
10.846
-0.103
-0.94%
jan 1, 1999
10.731
-0.114
-1.05%
jan 1, 2000
8.794
-1.937
-18.05%
jan 1, 2001
8.765
-0.029
-0.33%
jan 1, 2002
8.955
+0.191
2.18%
jan 1, 2003
8.557
-0.398
-4.45%
jan 1, 2004
8.139
-0.418
-4.89%
jan 1, 2005
9.076
+0.937
11.52%
jan 1, 2006
10.131
+1.055
11.62%
jan 1, 2007
10.568
+0.437
4.31%
jan 1, 2008
11.253
+0.685
6.48%
jan 1, 2009
9.758
-1.495
-13.28%
jan 1, 2010
9.942
+0.184
1.89%
jan 1, 2011
10.408
+0.466
4.68%
jan 1, 2012
10.807
+0.399
3.83%
jan 1, 2013
10.052
-0.756
-6.99%
jan 1, 2014
9.814
-0.237
-2.36%
jan 1, 2015
10.332
+0.518
5.27%
jan 1, 2016
9.553
-0.779
-7.54%
Ranking of countries by current statistics by years


Comments: