29
/
en
AIzaSyAYiBZKx7MnpbEhh9jyipgxe19OcubqV5w
April 1, 2024
276676
United States
USA
true
2
1
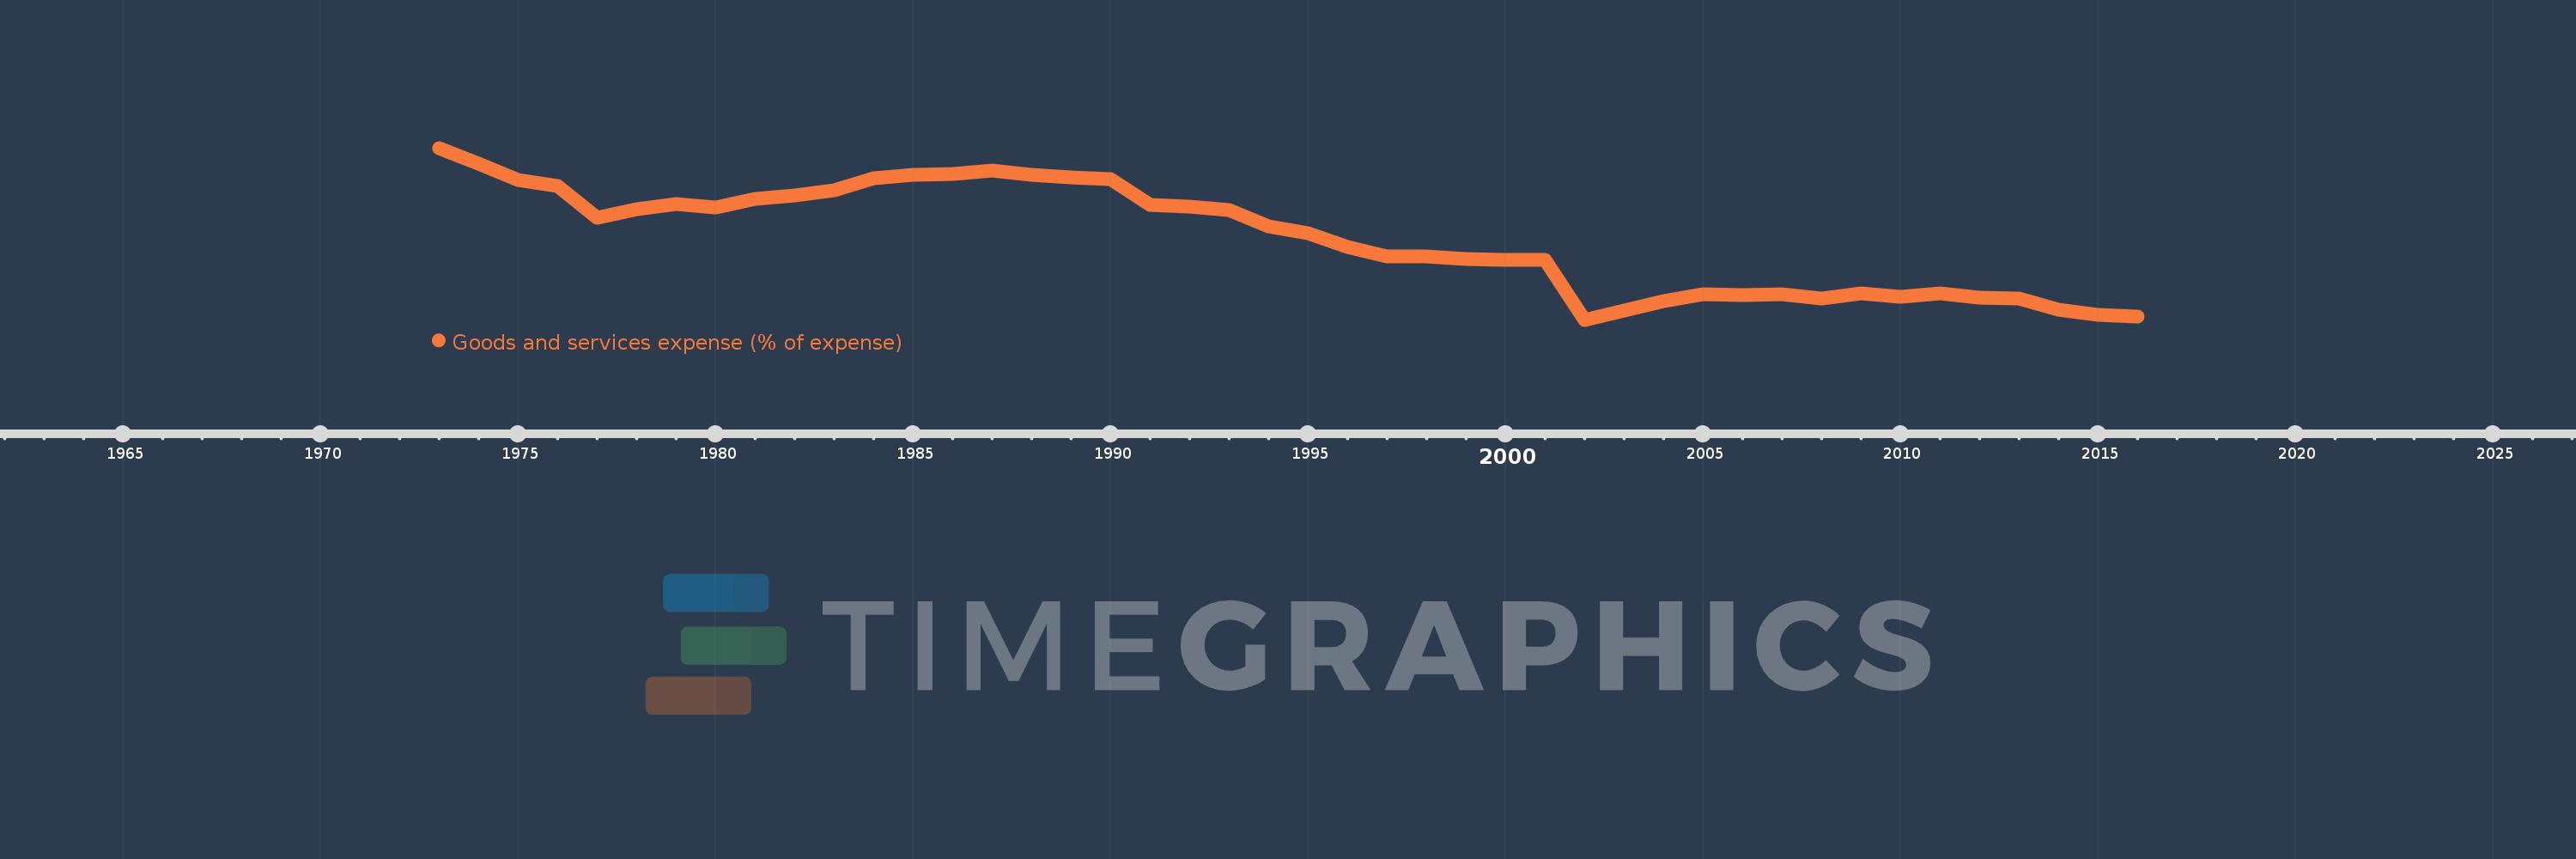
Goods and services expense (% of expense)
2016,2015,2014,2013,2012,2011,2010,2009,2008,2007,2006,2005,2004,2003,2002,2001,2000,1999,1998,1997,1996,1995,1994,1993,1992,1991,1990,1989,1988,1987,1986,1985,1984,1983,1982,1981,1980,1979,1978,1977,1976,1975,1974,1973
This statistics in other country:
AfghanistanAlbaniaAlgeriaAngolaAntigua and BarbudaArab WorldArmeniaAustraliaAustriaAzerbaijanBahamas, TheBahrainBangladeshBarbadosBelarusBelgiumBelizeBeninBhutanBoliviaBosnia and HerzegovinaBotswanaBrazilBulgariaBurkina FasoBurundiCabo VerdeCambodiaCanadaCaribbean small statesCentral African RepublicCentral Europe and the BalticsChileColombiaCongo, Dem. Rep.Congo, Rep.Costa RicaCote d'IvoireCroatiaCyprusCzech RepublicDenmarkDominicaDominican RepublicEarly-demographic dividendEast Asia & PacificEast Asia & Pacific (excluding high income)East Asia & Pacific (IDA & IBRD countries)Egypt, Arab Rep.El SalvadorEquatorial GuineaEstoniaEthiopiaEuro areaEurope & Central AsiaEurope & Central Asia (excluding high income)Europe & Central Asia (IDA & IBRD countries)European UnionFijiFinlandFranceGambia, TheGeorgiaGermanyGhanaGreeceGrenadaGuatemalaHeavily indebted poor countries (HIPC)High incomeHondurasHong Kong SAR, ChinaHungaryIBRD onlyIcelandIDA & IBRD totalIDA blendIDA onlyIDA totalIndiaIndonesiaIran, Islamic Rep.IraqIrelandIsraelItalyJamaicaJapanJordanKazakhstanKenyaKiribatiKorea, Rep.KuwaitKyrgyz RepublicLao PDRLate-demographic dividendLatin America & Caribbean Latin America & Caribbean (excluding high income)Latin America & the Caribbean (IDA & IBRD countries)LatviaLeast developed countries: UN classificationLebanonLesothoLiberiaLithuaniaLow & middle incomeLow incomeLower middle incomeLuxembourgMacao SAR, ChinaMacedonia, FYRMadagascarMalawiMalaysiaMaldivesMaliMaltaMauritiusMexicoMicronesia, Fed. Sts.Middle East & North AfricaMiddle East & North Africa (excluding high income)Middle East & North Africa (IDA & IBRD countries)Middle incomeMoldovaMongoliaMoroccoMozambiqueNamibiaNepalNetherlandsNew ZealandNicaraguaNigeriaNorth AmericaNorwayOECD membersOmanOther small statesPakistanPanamaPapua New GuineaParaguayPeruPhilippinesPolandPortugalPost-demographic dividendPre-demographic dividendQatarRomaniaRussian FederationRwandaSamoaSan MarinoSao Tome and PrincipeSenegalSerbiaSeychellesSierra LeoneSingaporeSlovak RepublicSloveniaSmall statesSolomon IslandsSouth AfricaSouth AsiaSouth Asia (IDA & IBRD)SpainSri LankaSt. Kitts and NevisSt. LuciaSub-Saharan Africa Sub-Saharan Africa (excluding high income)Sub-Saharan Africa (IDA & IBRD countries)SurinameSwazilandSwedenSwitzerlandSyrian Arab RepublicTajikistanTanzaniaThailandTimor-LesteTogoTrinidad and TobagoTunisiaTurkeyUgandaUkraineUnited Arab EmiratesUnited KingdomUnited StatesUpper middle incomeUruguayVanuatuVenezuela, RBWest Bank and GazaWorldYemen, Rep.ZambiaZimbabwe Timeline:
This timeline shows a graph from 1973 to 2016 of United States. No data until 1972. Number of actual observations by date: 44.
Source name:
World Development Indicators
Source organization:
International Monetary Fund, Government Finance Statistics Yearbook and data files.
Categories, topics:
Public Sector
Last updated:
apr 23, 2017
Indicators value changes by year
Maximum:
23.021
jan 1, 1973
At the date of observation
Value
Absolute change
Change from previous value
jan 1, 1973
23.021
+23.021
0.0%
jan 1, 1974
21.581
-1.441
-6.26%
jan 1, 1975
20.085
-1.496
-6.93%
jan 1, 1976
19.521
-0.564
-2.81%
jan 1, 1977
16.653
-2.868
-14.69%
jan 1, 1978
17.405
+0.752
4.52%
jan 1, 1979
17.892
+0.486
2.8%
jan 1, 1980
17.563
-0.328
-1.84%
jan 1, 1981
18.39
+0.827
4.71%
jan 1, 1982
18.668
+0.278
1.51%
jan 1, 1983
19.158
+0.491
2.63%
jan 1, 1984
20.288
+1.13
5.9%
jan 1, 1985
20.539
+0.251
1.24%
jan 1, 1986
20.646
+0.107
0.52%
jan 1, 1987
20.985
+0.338
1.64%
jan 1, 1988
20.559
-0.426
-2.03%
jan 1, 1989
20.348
-0.211
-1.02%
jan 1, 1990
20.152
-0.196
-0.96%
jan 1, 1991
17.846
-2.306
-11.45%
jan 1, 1992
17.695
-0.151
-0.85%
jan 1, 1993
17.328
-0.367
-2.07%
jan 1, 1994
15.868
-1.46
-8.42%
jan 1, 1995
15.195
-0.673
-4.24%
jan 1, 1996
13.98
-1.215
-8.0%
jan 1, 1997
13.082
-0.898
-6.42%
jan 1, 1998
13.117
+0.034
0.26%
jan 1, 1999
12.84
-0.277
-2.11%
jan 1, 2000
12.781
-0.059
-0.46%
jan 1, 2001
12.804
+0.023
0.18%
jan 1, 2002
7.333
-5.471
-42.73%
jan 1, 2003
8.199
+0.866
11.81%
jan 1, 2004
9.033
+0.834
10.17%
jan 1, 2005
9.698
+0.666
7.37%
jan 1, 2006
9.56
-0.138
-1.42%
jan 1, 2007
9.665
+0.104
1.09%
jan 1, 2008
9.286
-0.379
-3.92%
jan 1, 2009
9.775
+0.489
5.27%
jan 1, 2010
9.444
-0.331
-3.38%
jan 1, 2011
9.767
+0.322
3.41%
jan 1, 2012
9.369
-0.398
-4.07%
jan 1, 2013
9.268
-0.101
-1.08%
jan 1, 2014
8.265
-1.003
-10.82%
jan 1, 2015
7.775
-0.49
-5.93%
jan 1, 2016
7.598
-0.177
-2.28%
Ranking of countries by current statistics by years


Comments: