29
/
en
AIzaSyAYiBZKx7MnpbEhh9jyipgxe19OcubqV5w
April 1, 2024
240484
Singapore
SGP
true
2
1
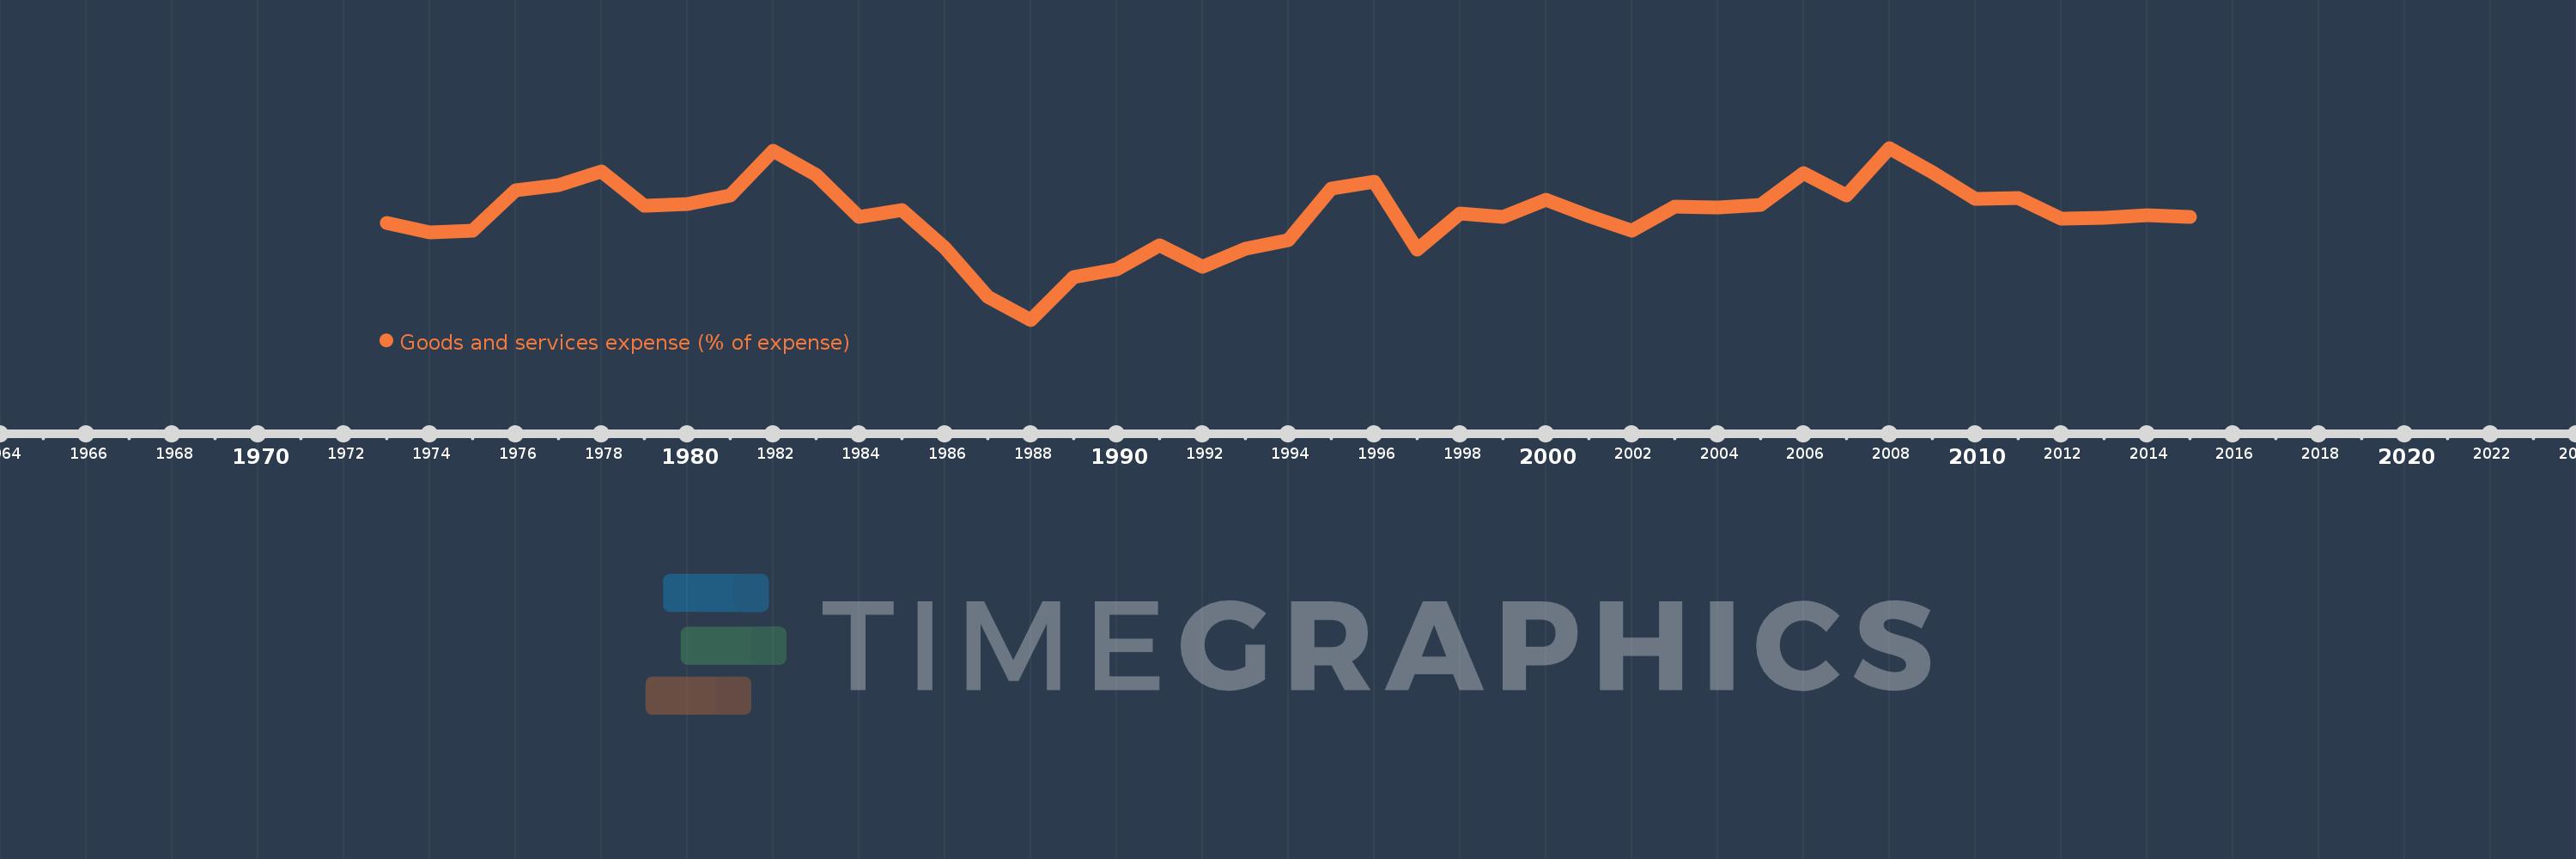
Goods and services expense (% of expense)
2015,2014,2013,2012,2011,2010,2009,2008,2007,2006,2005,2004,2003,2002,2001,2000,1999,1998,1997,1996,1995,1994,1993,1992,1991,1990,1989,1988,1987,1986,1985,1984,1983,1982,1981,1980,1979,1978,1977,1976,1975,1974,1973
This statistics in other country:
AfghanistanAlbaniaAlgeriaAngolaAntigua and BarbudaArab WorldArmeniaAustraliaAustriaAzerbaijanBahamas, TheBahrainBangladeshBarbadosBelarusBelgiumBelizeBeninBhutanBoliviaBosnia and HerzegovinaBotswanaBrazilBulgariaBurkina FasoBurundiCabo VerdeCambodiaCanadaCaribbean small statesCentral African RepublicCentral Europe and the BalticsChileColombiaCongo, Dem. Rep.Congo, Rep.Costa RicaCote d'IvoireCroatiaCyprusCzech RepublicDenmarkDominicaDominican RepublicEarly-demographic dividendEast Asia & PacificEast Asia & Pacific (excluding high income)East Asia & Pacific (IDA & IBRD countries)Egypt, Arab Rep.El SalvadorEquatorial GuineaEstoniaEthiopiaEuro areaEurope & Central AsiaEurope & Central Asia (excluding high income)Europe & Central Asia (IDA & IBRD countries)European UnionFijiFinlandFranceGambia, TheGeorgiaGermanyGhanaGreeceGrenadaGuatemalaHeavily indebted poor countries (HIPC)High incomeHondurasHong Kong SAR, ChinaHungaryIBRD onlyIcelandIDA & IBRD totalIDA blendIDA onlyIDA totalIndiaIndonesiaIran, Islamic Rep.IraqIrelandIsraelItalyJamaicaJapanJordanKazakhstanKenyaKiribatiKorea, Rep.KuwaitKyrgyz RepublicLao PDRLate-demographic dividendLatin America & Caribbean Latin America & Caribbean (excluding high income)Latin America & the Caribbean (IDA & IBRD countries)LatviaLeast developed countries: UN classificationLebanonLesothoLiberiaLithuaniaLow & middle incomeLow incomeLower middle incomeLuxembourgMacao SAR, ChinaMacedonia, FYRMadagascarMalawiMalaysiaMaldivesMaliMaltaMauritiusMexicoMicronesia, Fed. Sts.Middle East & North AfricaMiddle East & North Africa (excluding high income)Middle East & North Africa (IDA & IBRD countries)Middle incomeMoldovaMongoliaMoroccoMozambiqueNamibiaNepalNetherlandsNew ZealandNicaraguaNigeriaNorth AmericaNorwayOECD membersOmanOther small statesPakistanPanamaPapua New GuineaParaguayPeruPhilippinesPolandPortugalPost-demographic dividendPre-demographic dividendQatarRomaniaRussian FederationRwandaSamoaSan MarinoSao Tome and PrincipeSenegalSerbiaSeychellesSierra LeoneSingaporeSlovak RepublicSloveniaSmall statesSolomon IslandsSouth AfricaSouth AsiaSouth Asia (IDA & IBRD)SpainSri LankaSt. Kitts and NevisSt. LuciaSub-Saharan Africa Sub-Saharan Africa (excluding high income)Sub-Saharan Africa (IDA & IBRD countries)SurinameSwazilandSwedenSwitzerlandSyrian Arab RepublicTajikistanTanzaniaThailandTimor-LesteTogoTrinidad and TobagoTunisiaTurkeyUgandaUkraineUnited Arab EmiratesUnited KingdomUnited StatesUpper middle incomeUruguayVanuatuVenezuela, RBWest Bank and GazaWorldYemen, Rep.ZambiaZimbabwe Timeline:
This timeline shows a graph from 1973 to 2015 of Singapore. No data until 1972. Number of actual observations by date: 43.
Source name:
World Development Indicators
Source organization:
International Monetary Fund, Government Finance Statistics Yearbook and data files.
Categories, topics:
Public Sector
Last updated:
apr 23, 2017
Indicators value changes by year
Minimum:
16.699
jan 1, 1988
Maximum:
43.507
jan 1, 2008
At the date of observation
Value
Absolute change
Change from previous value
jan 1, 1973
31.807
+31.807
0.0%
jan 1, 1974
30.368
-1.439
-4.52%
jan 1, 1975
30.619
+0.251
0.83%
jan 1, 1976
36.882
+6.263
20.45%
jan 1, 1977
37.651
+0.768
2.08%
jan 1, 1978
39.866
+2.215
5.88%
jan 1, 1979
34.446
-5.42
-13.6%
jan 1, 1980
34.796
+0.35
1.02%
jan 1, 1981
36.075
+1.279
3.67%
jan 1, 1982
43.052
+6.978
19.34%
jan 1, 1983
39.294
-3.758
-8.73%
jan 1, 1984
32.755
-6.539
-16.64%
jan 1, 1985
33.839
+1.084
3.31%
jan 1, 1986
27.876
-5.963
-17.62%
jan 1, 1987
20.281
-7.596
-27.25%
jan 1, 1988
16.699
-3.581
-17.66%
jan 1, 1989
23.402
+6.703
40.14%
jan 1, 1990
24.587
+1.184
5.06%
jan 1, 1991
28.371
+3.784
15.39%
jan 1, 1992
24.968
-3.403
-11.99%
jan 1, 1993
27.778
+2.81
11.26%
jan 1, 1994
29.188
+1.41
5.08%
jan 1, 1995
37.106
+7.918
27.13%
jan 1, 1996
38.224
+1.118
3.01%
jan 1, 1997
27.67
-10.554
-27.61%
jan 1, 1998
33.343
+5.673
20.5%
jan 1, 1999
32.757
-0.586
-1.76%
jan 1, 2000
35.459
+2.702
8.25%
jan 1, 2001
32.871
-2.588
-7.3%
jan 1, 2002
30.6
-2.271
-6.91%
jan 1, 2003
34.377
+3.777
12.34%
jan 1, 2004
34.273
-0.105
-0.3%
jan 1, 2005
34.564
+0.291
0.85%
jan 1, 2006
39.582
+5.018
14.52%
jan 1, 2007
36.138
-3.444
-8.7%
jan 1, 2008
43.507
+7.37
20.39%
jan 1, 2009
39.741
-3.767
-8.66%
jan 1, 2010
35.567
-4.173
-10.5%
jan 1, 2011
35.754
+0.187
0.53%
jan 1, 2012
32.452
-3.302
-9.24%
jan 1, 2013
32.626
+0.174
0.54%
jan 1, 2014
33.006
+0.379
1.16%
jan 1, 2015
32.683
-0.323
-0.98%
Ranking of countries by current statistics by years


Comments: