29
/
en
AIzaSyAYiBZKx7MnpbEhh9jyipgxe19OcubqV5w
April 1, 2024
160520
Israel
ISR
true
2
1
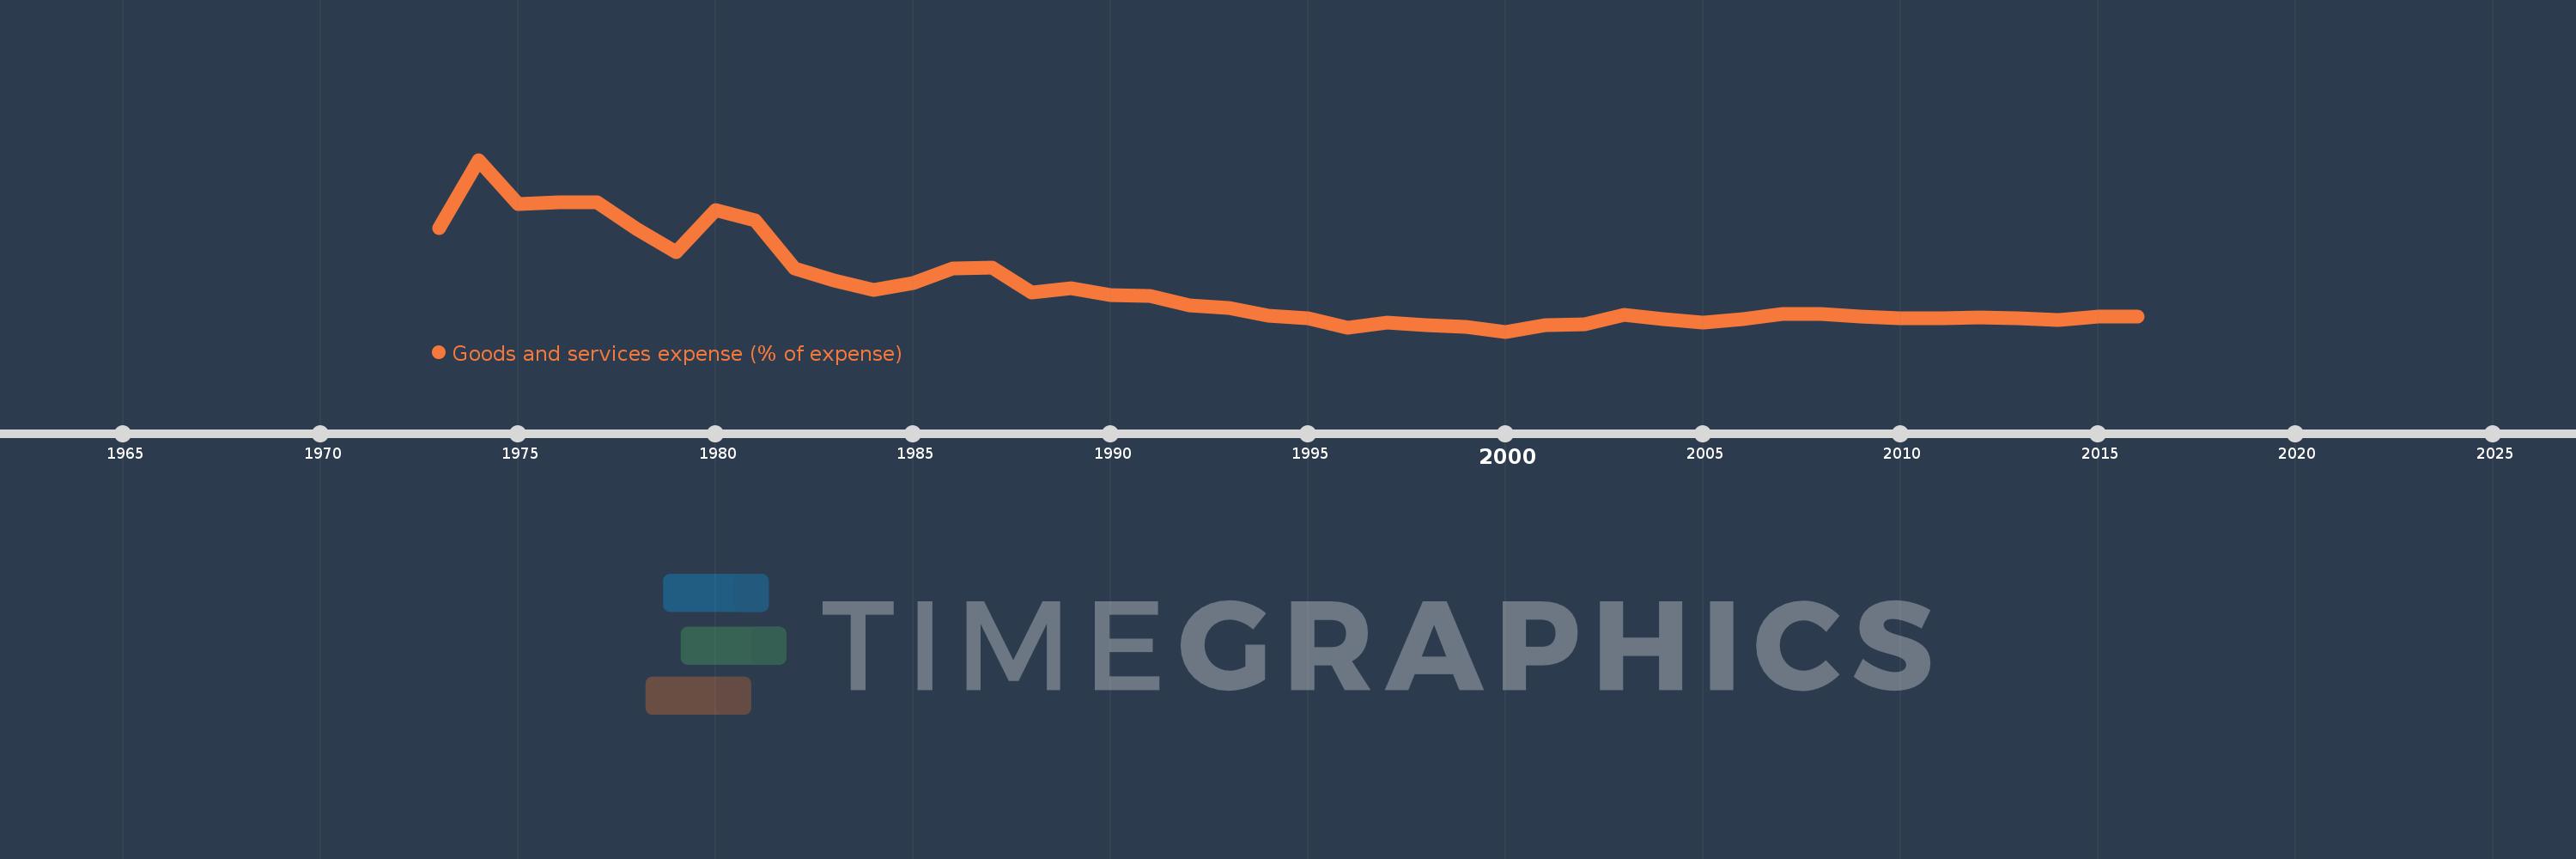
Goods and services expense (% of expense)
2016,2015,2014,2013,2012,2011,2010,2009,2008,2007,2006,2005,2004,2003,2002,2001,2000,1999,1998,1997,1996,1995,1994,1993,1992,1991,1990,1989,1988,1987,1986,1985,1984,1983,1982,1981,1980,1979,1978,1977,1976,1975,1974,1973
This statistics in other country:
AfghanistanAlbaniaAlgeriaAngolaAntigua and BarbudaArab WorldArmeniaAustraliaAustriaAzerbaijanBahamas, TheBahrainBangladeshBarbadosBelarusBelgiumBelizeBeninBhutanBoliviaBosnia and HerzegovinaBotswanaBrazilBulgariaBurkina FasoBurundiCabo VerdeCambodiaCanadaCaribbean small statesCentral African RepublicCentral Europe and the BalticsChileColombiaCongo, Dem. Rep.Congo, Rep.Costa RicaCote d'IvoireCroatiaCyprusCzech RepublicDenmarkDominicaDominican RepublicEarly-demographic dividendEast Asia & PacificEast Asia & Pacific (excluding high income)East Asia & Pacific (IDA & IBRD countries)Egypt, Arab Rep.El SalvadorEquatorial GuineaEstoniaEthiopiaEuro areaEurope & Central AsiaEurope & Central Asia (excluding high income)Europe & Central Asia (IDA & IBRD countries)European UnionFijiFinlandFranceGambia, TheGeorgiaGermanyGhanaGreeceGrenadaGuatemalaHeavily indebted poor countries (HIPC)High incomeHondurasHong Kong SAR, ChinaHungaryIBRD onlyIcelandIDA & IBRD totalIDA blendIDA onlyIDA totalIndiaIndonesiaIran, Islamic Rep.IraqIrelandIsraelItalyJamaicaJapanJordanKazakhstanKenyaKiribatiKorea, Rep.KuwaitKyrgyz RepublicLao PDRLate-demographic dividendLatin America & Caribbean Latin America & Caribbean (excluding high income)Latin America & the Caribbean (IDA & IBRD countries)LatviaLeast developed countries: UN classificationLebanonLesothoLiberiaLithuaniaLow & middle incomeLow incomeLower middle incomeLuxembourgMacao SAR, ChinaMacedonia, FYRMadagascarMalawiMalaysiaMaldivesMaliMaltaMauritiusMexicoMicronesia, Fed. Sts.Middle East & North AfricaMiddle East & North Africa (excluding high income)Middle East & North Africa (IDA & IBRD countries)Middle incomeMoldovaMongoliaMoroccoMozambiqueNamibiaNepalNetherlandsNew ZealandNicaraguaNigeriaNorth AmericaNorwayOECD membersOmanOther small statesPakistanPanamaPapua New GuineaParaguayPeruPhilippinesPolandPortugalPost-demographic dividendPre-demographic dividendQatarRomaniaRussian FederationRwandaSamoaSan MarinoSao Tome and PrincipeSenegalSerbiaSeychellesSierra LeoneSingaporeSlovak RepublicSloveniaSmall statesSolomon IslandsSouth AfricaSouth AsiaSouth Asia (IDA & IBRD)SpainSri LankaSt. Kitts and NevisSt. LuciaSub-Saharan Africa Sub-Saharan Africa (excluding high income)Sub-Saharan Africa (IDA & IBRD countries)SurinameSwazilandSwedenSwitzerlandSyrian Arab RepublicTajikistanTanzaniaThailandTimor-LesteTogoTrinidad and TobagoTunisiaTurkeyUgandaUkraineUnited Arab EmiratesUnited KingdomUnited StatesUpper middle incomeUruguayVanuatuVenezuela, RBWest Bank and GazaWorldYemen, Rep.ZambiaZimbabwe Timeline:
This timeline shows a graph from 1973 to 2016 of Israel. No data until 1972. Number of actual observations by date: 44.
Source name:
World Development Indicators
Source organization:
International Monetary Fund, Government Finance Statistics Yearbook and data files.
Categories, topics:
Public Sector
Last updated:
apr 23, 2017
Indicators value changes by year
At the date of observation
Value
Absolute change
Change from previous value
jan 1, 1973
35.714
+35.714
0.0%
jan 1, 1974
48.0
+12.286
34.4%
jan 1, 1975
40.0
-8.0
-16.67%
jan 1, 1976
40.385
+0.385
0.96%
jan 1, 1977
40.278
-0.107
-0.26%
jan 1, 1978
35.514
-4.764
-11.83%
jan 1, 1979
31.447
-4.067
-11.45%
jan 1, 1980
38.988
+7.542
23.98%
jan 1, 1981
37.065
-1.923
-4.93%
jan 1, 1982
28.448
-8.616
-23.25%
jan 1, 1983
26.267
-2.182
-7.67%
jan 1, 1984
24.604
-1.663
-6.33%
jan 1, 1985
25.833
+1.229
5.0%
jan 1, 1986
28.468
+2.635
10.2%
jan 1, 1987
28.653
+0.184
0.65%
jan 1, 1988
24.084
-4.569
-15.95%
jan 1, 1989
24.958
+0.874
3.63%
jan 1, 1990
23.584
-1.374
-5.5%
jan 1, 1991
23.449
-0.136
-0.58%
jan 1, 1992
21.738
-1.71
-7.29%
jan 1, 1993
21.399
-0.339
-1.56%
jan 1, 1994
19.91
-1.488
-6.95%
jan 1, 1995
19.521
-0.39
-1.96%
jan 1, 1996
17.826
-1.695
-8.68%
jan 1, 1997
18.632
+0.806
4.52%
jan 1, 1998
18.168
-0.464
-2.49%
jan 1, 1999
17.972
-0.196
-1.08%
jan 1, 2000
17.08
-0.892
-4.96%
jan 1, 2001
18.191
+1.112
6.51%
jan 1, 2002
18.324
+0.133
0.73%
jan 1, 2003
20.061
+1.737
9.48%
jan 1, 2004
19.321
-0.74
-3.69%
jan 1, 2005
18.754
-0.568
-2.94%
jan 1, 2006
19.383
+0.629
3.36%
jan 1, 2007
20.312
+0.929
4.79%
jan 1, 2008
20.201
-0.111
-0.55%
jan 1, 2009
19.846
-0.355
-1.76%
jan 1, 2010
19.402
-0.444
-2.24%
jan 1, 2011
19.47
+0.068
0.35%
jan 1, 2012
19.569
+0.1
0.51%
jan 1, 2013
19.479
-0.09
-0.46%
jan 1, 2014
19.189
-0.29
-1.49%
jan 1, 2015
19.854
+0.664
3.46%
jan 1, 2016
19.774
-0.079
-0.4%
Ranking of countries by current statistics by years


Comments: