29
/
en
AIzaSyAYiBZKx7MnpbEhh9jyipgxe19OcubqV5w
April 1, 2024
24913
Caribbean small states
CSS
false
2
1
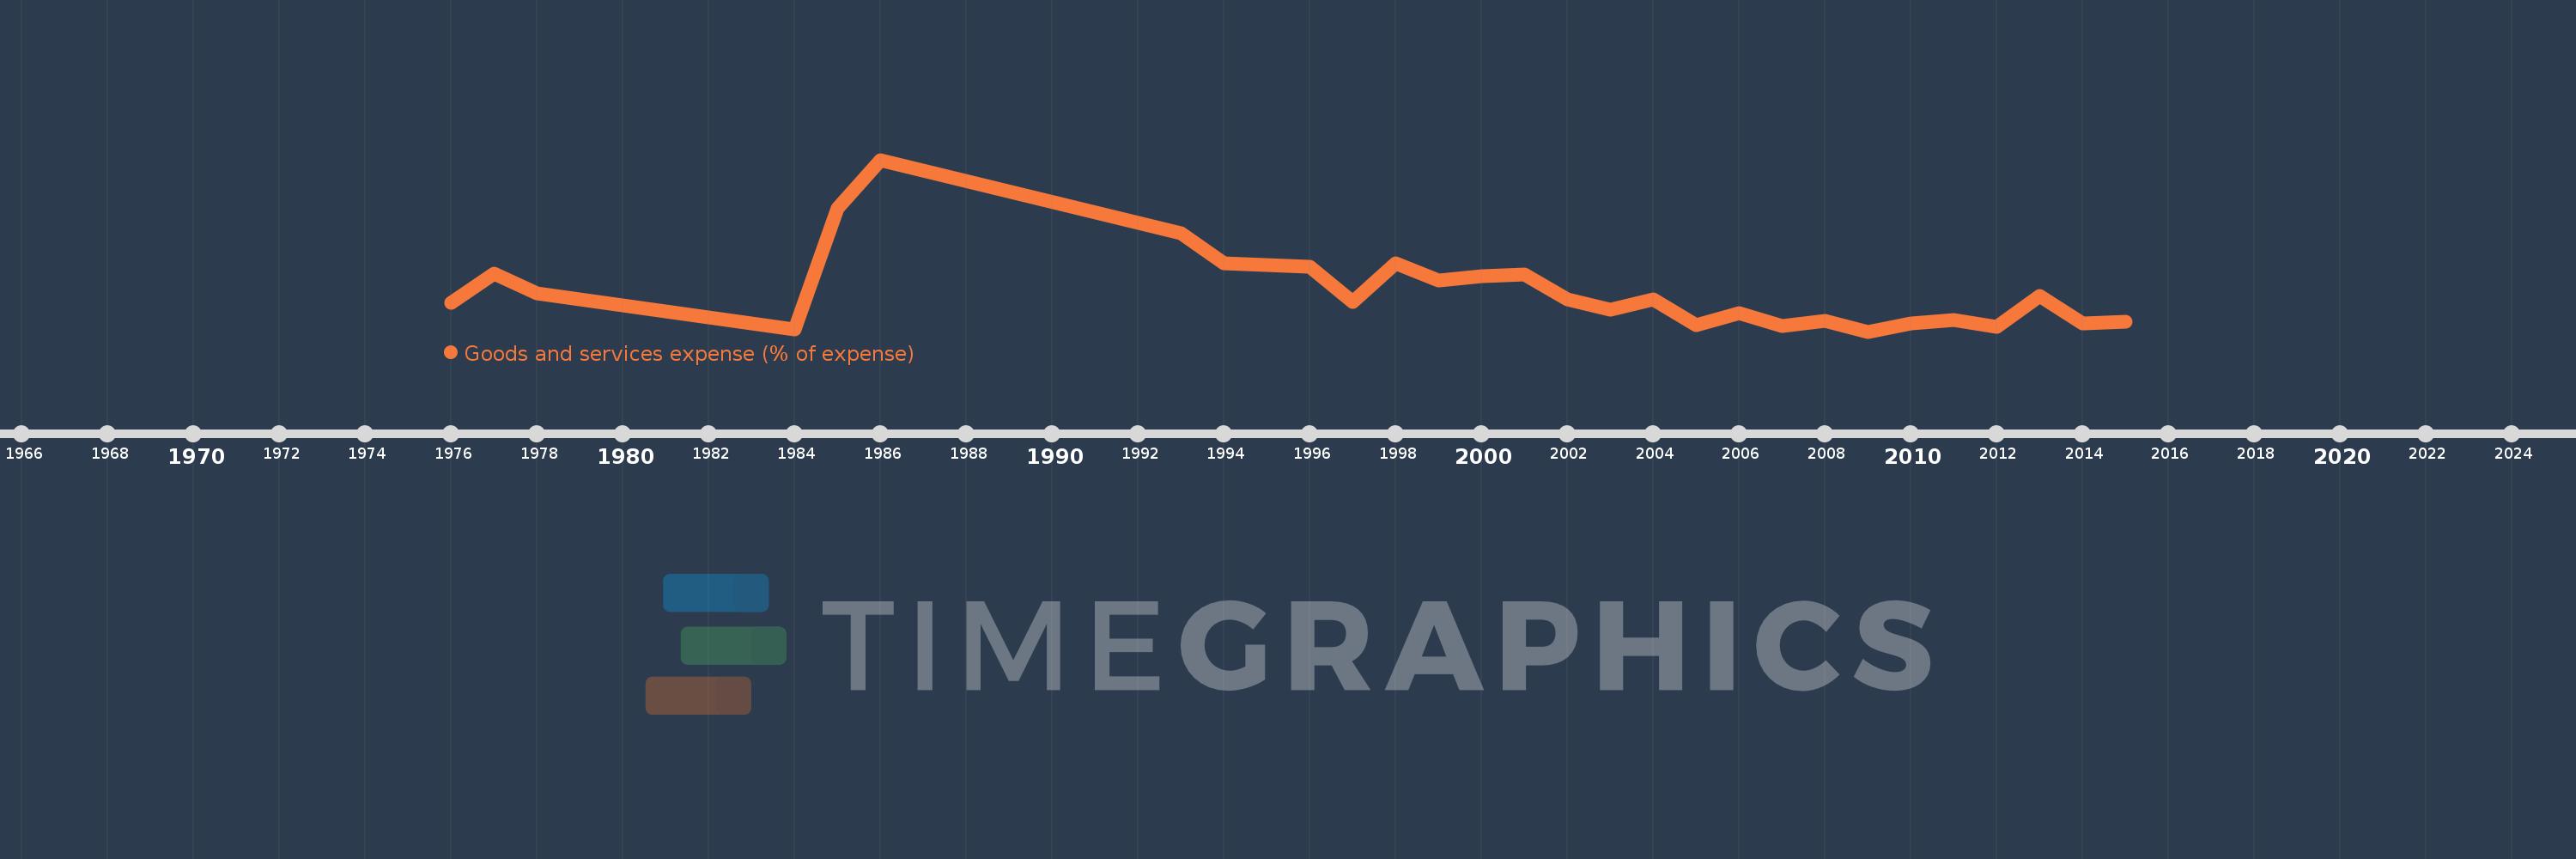
Goods and services expense (% of expense)
2015,2014,2013,2012,2011,2010,2009,2008,2007,2006,2005,2004,2003,2002,2001,2000,1999,1998,1997,1996,1995,1994,1993,1986,1985,1984,1978,1977,1976
This statistics in other country:
AfghanistanAlbaniaAlgeriaAngolaAntigua and BarbudaArab WorldArmeniaAustraliaAustriaAzerbaijanBahamas, TheBahrainBangladeshBarbadosBelarusBelgiumBelizeBeninBhutanBoliviaBosnia and HerzegovinaBotswanaBrazilBulgariaBurkina FasoBurundiCabo VerdeCambodiaCanadaCaribbean small statesCentral African RepublicCentral Europe and the BalticsChileColombiaCongo, Dem. Rep.Congo, Rep.Costa RicaCote d'IvoireCroatiaCyprusCzech RepublicDenmarkDominicaDominican RepublicEarly-demographic dividendEast Asia & PacificEast Asia & Pacific (excluding high income)East Asia & Pacific (IDA & IBRD countries)Egypt, Arab Rep.El SalvadorEquatorial GuineaEstoniaEthiopiaEuro areaEurope & Central AsiaEurope & Central Asia (excluding high income)Europe & Central Asia (IDA & IBRD countries)European UnionFijiFinlandFranceGambia, TheGeorgiaGermanyGhanaGreeceGrenadaGuatemalaHeavily indebted poor countries (HIPC)High incomeHondurasHong Kong SAR, ChinaHungaryIBRD onlyIcelandIDA & IBRD totalIDA blendIDA onlyIDA totalIndiaIndonesiaIran, Islamic Rep.IraqIrelandIsraelItalyJamaicaJapanJordanKazakhstanKenyaKiribatiKorea, Rep.KuwaitKyrgyz RepublicLao PDRLate-demographic dividendLatin America & Caribbean Latin America & Caribbean (excluding high income)Latin America & the Caribbean (IDA & IBRD countries)LatviaLeast developed countries: UN classificationLebanonLesothoLiberiaLithuaniaLow & middle incomeLow incomeLower middle incomeLuxembourgMacao SAR, ChinaMacedonia, FYRMadagascarMalawiMalaysiaMaldivesMaliMaltaMauritiusMexicoMicronesia, Fed. Sts.Middle East & North AfricaMiddle East & North Africa (excluding high income)Middle East & North Africa (IDA & IBRD countries)Middle incomeMoldovaMongoliaMoroccoMozambiqueNamibiaNepalNetherlandsNew ZealandNicaraguaNigeriaNorth AmericaNorwayOECD membersOmanOther small statesPakistanPanamaPapua New GuineaParaguayPeruPhilippinesPolandPortugalPost-demographic dividendPre-demographic dividendQatarRomaniaRussian FederationRwandaSamoaSan MarinoSao Tome and PrincipeSenegalSerbiaSeychellesSierra LeoneSingaporeSlovak RepublicSloveniaSmall statesSolomon IslandsSouth AfricaSouth AsiaSouth Asia (IDA & IBRD)SpainSri LankaSt. Kitts and NevisSt. LuciaSub-Saharan Africa Sub-Saharan Africa (excluding high income)Sub-Saharan Africa (IDA & IBRD countries)SurinameSwazilandSwedenSwitzerlandSyrian Arab RepublicTajikistanTanzaniaThailandTimor-LesteTogoTrinidad and TobagoTunisiaTurkeyUgandaUkraineUnited Arab EmiratesUnited KingdomUnited StatesUpper middle incomeUruguayVanuatuVenezuela, RBWest Bank and GazaWorldYemen, Rep.ZambiaZimbabwe Timeline:
This timeline shows a graph from 1976 to 2015 of Caribbean small states. No data until 1975. Number of actual observations by date: 29.
Source name:
World Development Indicators
Source organization:
International Monetary Fund, Government Finance Statistics Yearbook and data files.
Categories, topics:
Public Sector
Last updated:
apr 23, 2017
Indicators value changes by year
Minimum:
10.733
jan 1, 2009
Maximum:
38.324
jan 1, 1986
At the date of observation
Value
Absolute change
Change from previous value
jan 1, 1976
15.406
+15.406
0.0%
jan 1, 1977
20.079
+4.673
30.33%
jan 1, 1978
16.848
-3.23
-16.09%
jan 1, 1984
11.06
-5.788
-34.35%
jan 1, 1985
30.582
+19.522
176.5%
jan 1, 1986
38.324
+7.741
25.31%
jan 1, 1993
26.584
-11.739
-30.63%
jan 1, 1994
21.745
-4.839
-18.2%
jan 1, 1995
21.361
-0.384
-1.77%
jan 1, 1996
21.217
-0.144
-0.67%
jan 1, 1997
15.446
-5.772
-27.2%
jan 1, 1998
21.655
+6.209
40.2%
jan 1, 1999
18.915
-2.74
-12.65%
jan 1, 2000
19.658
+0.744
3.93%
jan 1, 2001
19.877
+0.218
1.11%
jan 1, 2002
15.949
-3.928
-19.76%
jan 1, 2003
14.302
-1.647
-10.33%
jan 1, 2004
15.924
+1.623
11.35%
jan 1, 2005
11.738
-4.186
-26.29%
jan 1, 2006
13.686
+1.947
16.59%
jan 1, 2007
11.692
-1.994
-14.57%
jan 1, 2008
12.429
+0.737
6.3%
jan 1, 2009
10.733
-1.696
-13.64%
jan 1, 2010
12.088
+1.355
12.62%
jan 1, 2011
12.626
+0.538
4.45%
jan 1, 2012
11.496
-1.13
-8.95%
jan 1, 2013
16.447
+4.951
43.07%
jan 1, 2014
12.062
-4.385
-26.66%
jan 1, 2015
12.258
+0.196
1.62%
Ranking of countries by current statistics by years


Comments: