29
/
en
AIzaSyAYiBZKx7MnpbEhh9jyipgxe19OcubqV5w
April 1, 2024
139301
Germany
DEU
true
2
1
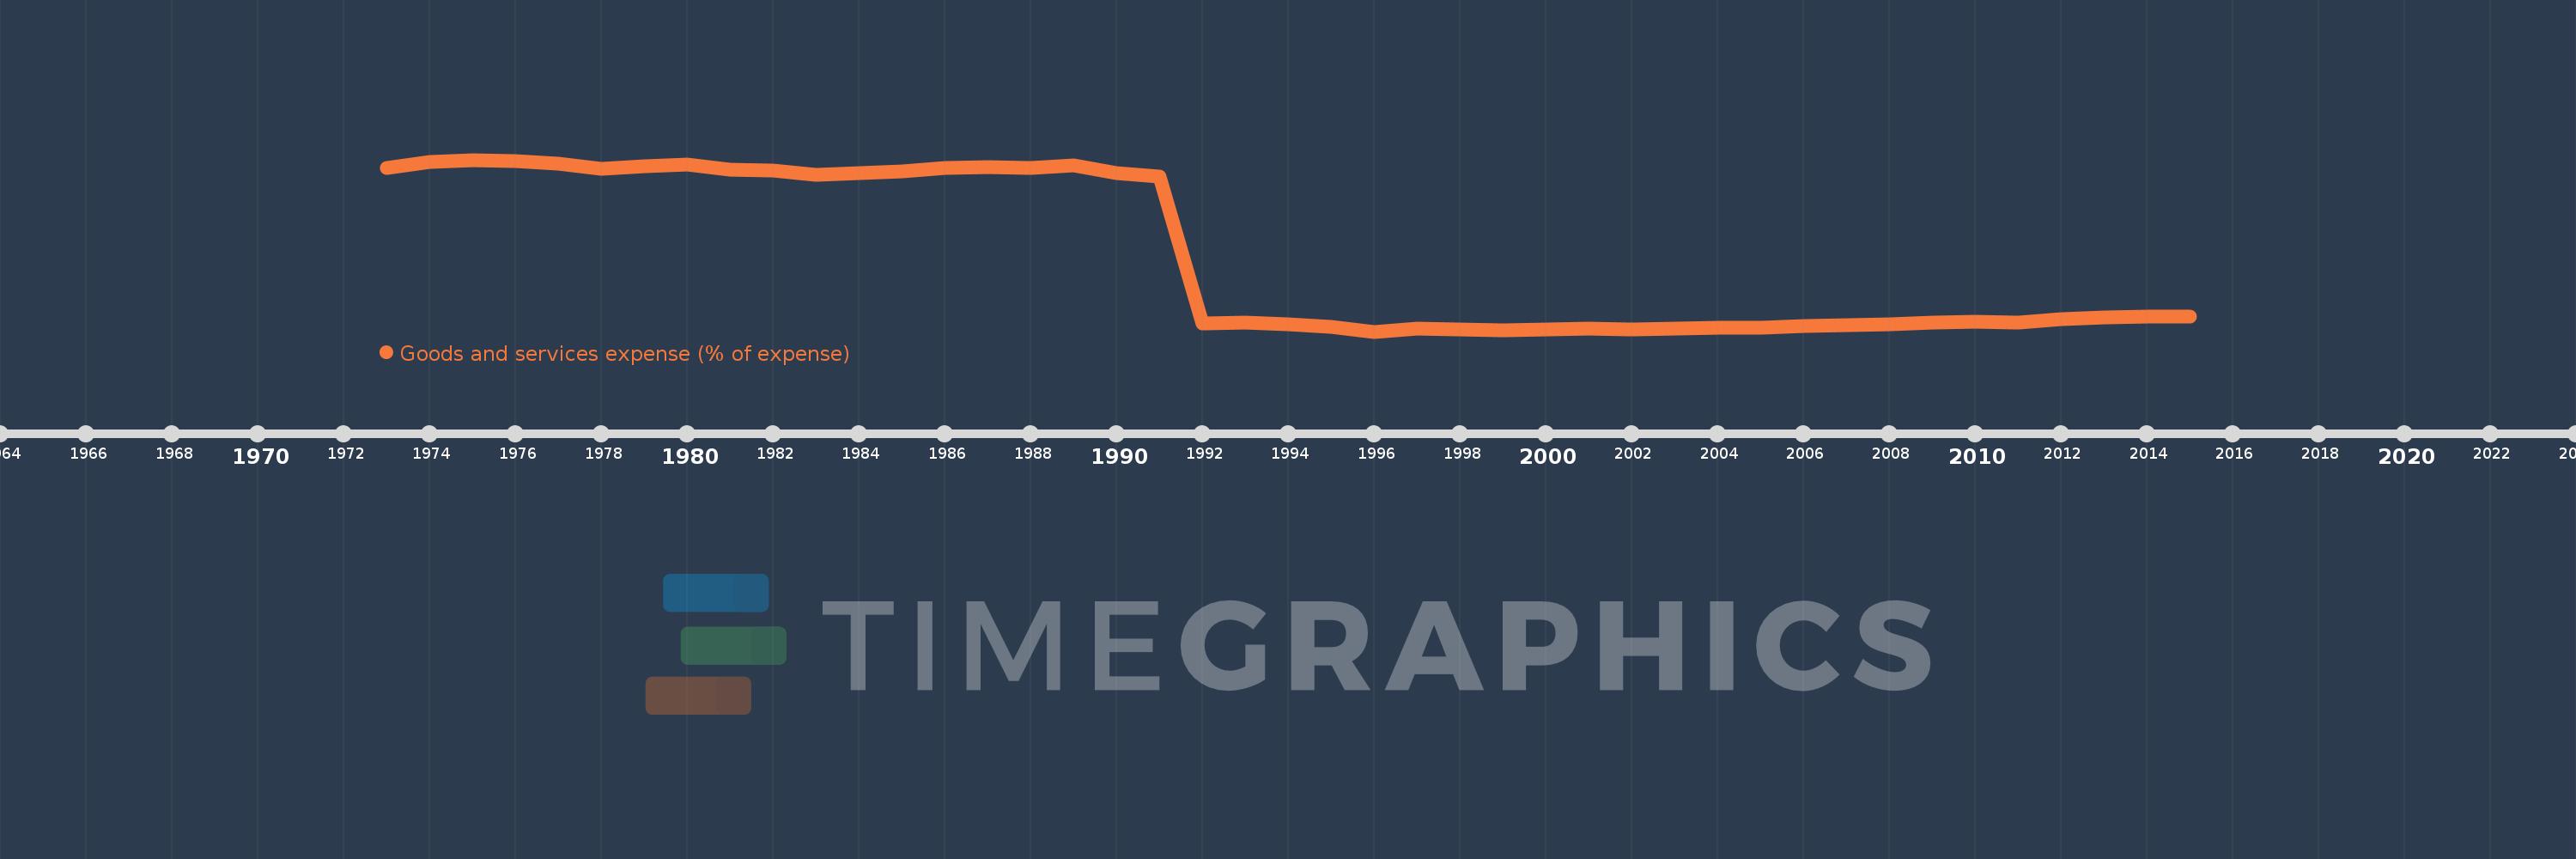
Goods and services expense (% of expense)
2015,2014,2013,2012,2011,2010,2009,2008,2007,2006,2005,2004,2003,2002,2001,2000,1999,1998,1997,1996,1995,1994,1993,1992,1991,1990,1989,1988,1987,1986,1985,1984,1983,1982,1981,1980,1979,1978,1977,1976,1975,1974,1973
This statistics in other country:
AfghanistanAlbaniaAlgeriaAngolaAntigua and BarbudaArab WorldArmeniaAustraliaAustriaAzerbaijanBahamas, TheBahrainBangladeshBarbadosBelarusBelgiumBelizeBeninBhutanBoliviaBosnia and HerzegovinaBotswanaBrazilBulgariaBurkina FasoBurundiCabo VerdeCambodiaCanadaCaribbean small statesCentral African RepublicCentral Europe and the BalticsChileColombiaCongo, Dem. Rep.Congo, Rep.Costa RicaCote d'IvoireCroatiaCyprusCzech RepublicDenmarkDominicaDominican RepublicEarly-demographic dividendEast Asia & PacificEast Asia & Pacific (excluding high income)East Asia & Pacific (IDA & IBRD countries)Egypt, Arab Rep.El SalvadorEquatorial GuineaEstoniaEthiopiaEuro areaEurope & Central AsiaEurope & Central Asia (excluding high income)Europe & Central Asia (IDA & IBRD countries)European UnionFijiFinlandFranceGambia, TheGeorgiaGermanyGhanaGreeceGrenadaGuatemalaHeavily indebted poor countries (HIPC)High incomeHondurasHong Kong SAR, ChinaHungaryIBRD onlyIcelandIDA & IBRD totalIDA blendIDA onlyIDA totalIndiaIndonesiaIran, Islamic Rep.IraqIrelandIsraelItalyJamaicaJapanJordanKazakhstanKenyaKiribatiKorea, Rep.KuwaitKyrgyz RepublicLao PDRLate-demographic dividendLatin America & Caribbean Latin America & Caribbean (excluding high income)Latin America & the Caribbean (IDA & IBRD countries)LatviaLeast developed countries: UN classificationLebanonLesothoLiberiaLithuaniaLow & middle incomeLow incomeLower middle incomeLuxembourgMacao SAR, ChinaMacedonia, FYRMadagascarMalawiMalaysiaMaldivesMaliMaltaMauritiusMexicoMicronesia, Fed. Sts.Middle East & North AfricaMiddle East & North Africa (excluding high income)Middle East & North Africa (IDA & IBRD countries)Middle incomeMoldovaMongoliaMoroccoMozambiqueNamibiaNepalNetherlandsNew ZealandNicaraguaNigeriaNorth AmericaNorwayOECD membersOmanOther small statesPakistanPanamaPapua New GuineaParaguayPeruPhilippinesPolandPortugalPost-demographic dividendPre-demographic dividendQatarRomaniaRussian FederationRwandaSamoaSan MarinoSao Tome and PrincipeSenegalSerbiaSeychellesSierra LeoneSingaporeSlovak RepublicSloveniaSmall statesSolomon IslandsSouth AfricaSouth AsiaSouth Asia (IDA & IBRD)SpainSri LankaSt. Kitts and NevisSt. LuciaSub-Saharan Africa Sub-Saharan Africa (excluding high income)Sub-Saharan Africa (IDA & IBRD countries)SurinameSwazilandSwedenSwitzerlandSyrian Arab RepublicTajikistanTanzaniaThailandTimor-LesteTogoTrinidad and TobagoTunisiaTurkeyUgandaUkraineUnited Arab EmiratesUnited KingdomUnited StatesUpper middle incomeUruguayVanuatuVenezuela, RBWest Bank and GazaWorldYemen, Rep.ZambiaZimbabwe Timeline:
This timeline shows a graph from 1973 to 2015 of Germany. No data until 1972. Number of actual observations by date: 43.
Source name:
World Development Indicators
Source organization:
International Monetary Fund, Government Finance Statistics Yearbook and data files.
Categories, topics:
Public Sector
Last updated:
apr 23, 2017
Indicators value changes by year
Maximum:
27.042
jan 1, 1975
At the date of observation
Value
Absolute change
Change from previous value
jan 1, 1973
25.939
+25.939
0.0%
jan 1, 1974
26.704
+0.765
2.95%
jan 1, 1975
27.042
+0.338
1.27%
jan 1, 1976
26.915
-0.127
-0.47%
jan 1, 1977
26.516
-0.4
-1.49%
jan 1, 1978
25.758
-0.758
-2.86%
jan 1, 1979
26.097
+0.339
1.32%
jan 1, 1980
26.424
+0.327
1.25%
jan 1, 1981
25.606
-0.818
-3.1%
jan 1, 1982
25.553
-0.053
-0.21%
jan 1, 1983
24.966
-0.588
-2.3%
jan 1, 1984
25.142
+0.176
0.71%
jan 1, 1985
25.444
+0.302
1.2%
jan 1, 1986
25.848
+0.404
1.59%
jan 1, 1987
26.069
+0.222
0.86%
jan 1, 1988
25.887
-0.182
-0.7%
jan 1, 1989
26.304
+0.417
1.61%
jan 1, 1990
25.189
-1.115
-4.24%
jan 1, 1991
24.707
-0.481
-1.91%
jan 1, 1992
3.869
-20.838
-84.34%
jan 1, 1993
4.035
+0.166
4.3%
jan 1, 1994
3.782
-0.253
-6.27%
jan 1, 1995
3.405
-0.377
-9.98%
jan 1, 1996
2.742
-0.663
-19.46%
jan 1, 1997
3.161
+0.419
15.27%
jan 1, 1998
2.987
-0.174
-5.5%
jan 1, 1999
2.985
-0.002
-0.07%
jan 1, 2000
3.08
+0.095
3.18%
jan 1, 2001
3.109
+0.029
0.93%
jan 1, 2002
3.101
-0.008
-0.26%
jan 1, 2003
3.174
+0.073
2.35%
jan 1, 2004
3.238
+0.064
2.02%
jan 1, 2005
3.241
+0.003
0.11%
jan 1, 2006
3.565
+0.324
10.0%
jan 1, 2007
3.656
+0.091
2.55%
jan 1, 2008
3.741
+0.085
2.32%
jan 1, 2009
4.0
+0.259
6.92%
jan 1, 2010
4.12
+0.121
3.01%
jan 1, 2011
4.012
-0.108
-2.63%
jan 1, 2012
4.45
+0.438
10.92%
jan 1, 2013
4.794
+0.344
7.73%
jan 1, 2014
4.929
+0.135
2.81%
jan 1, 2015
4.81
-0.119
-2.41%
Ranking of countries by current statistics by years


Comments: