29
/
en
AIzaSyAYiBZKx7MnpbEhh9jyipgxe19OcubqV5w
April 1, 2024
54803
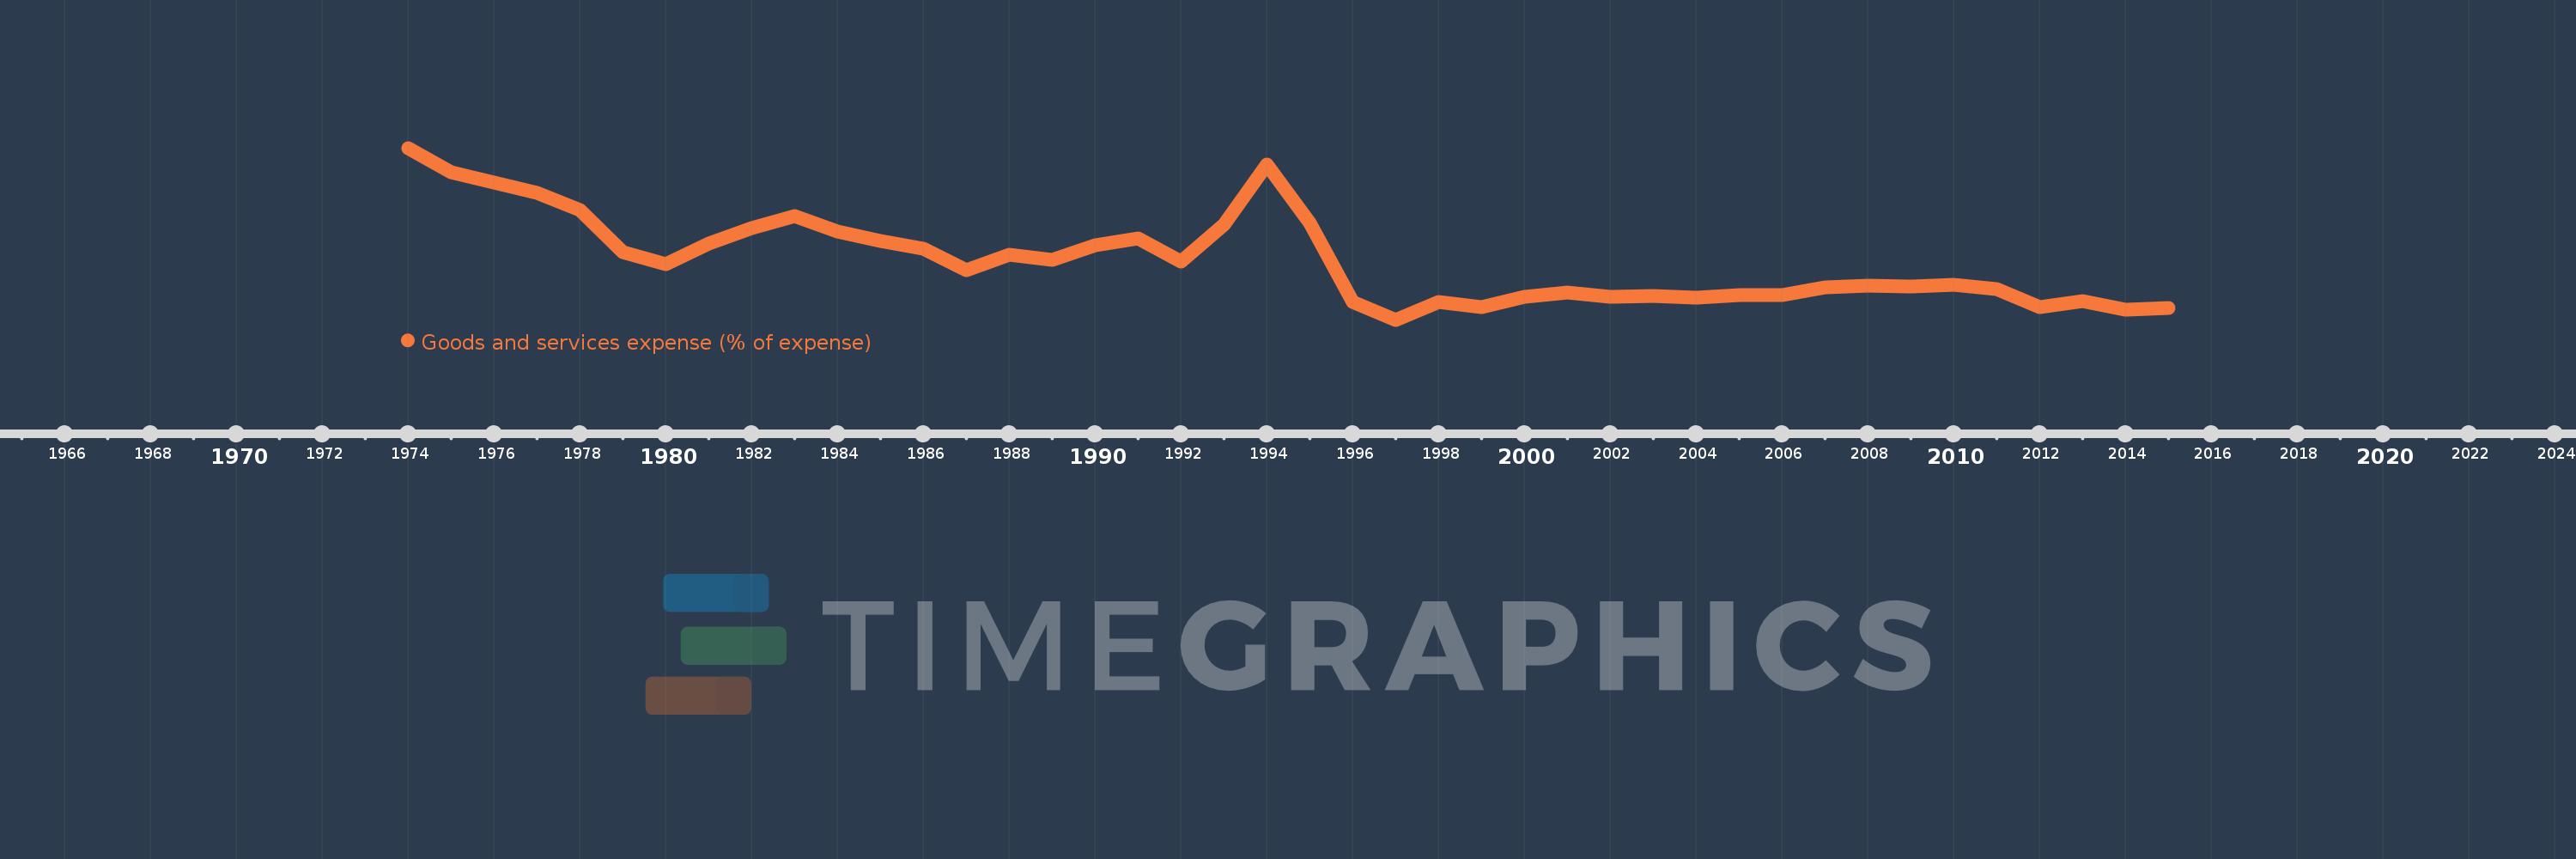
Post-demographic dividend
PST
false
2
1
Goods and services expense (% of expense)
2015,2014,2013,2012,2011,2010,2009,2008,2007,2006,2005,2004,2003,2002,2001,2000,1999,1998,1997,1996,1995,1994,1993,1992,1991,1990,1989,1988,1987,1986,1985,1984,1983,1982,1981,1980,1979,1978,1977,1976,1975,1974
This statistics in other country:
AfghanistanAlbaniaAlgeriaAngolaAntigua and BarbudaArab WorldArmeniaAustraliaAustriaAzerbaijanBahamas, TheBahrainBangladeshBarbadosBelarusBelgiumBelizeBeninBhutanBoliviaBosnia and HerzegovinaBotswanaBrazilBulgariaBurkina FasoBurundiCabo VerdeCambodiaCanadaCaribbean small statesCentral African RepublicCentral Europe and the BalticsChileColombiaCongo, Dem. Rep.Congo, Rep.Costa RicaCote d'IvoireCroatiaCyprusCzech RepublicDenmarkDominicaDominican RepublicEarly-demographic dividendEast Asia & PacificEast Asia & Pacific (excluding high income)East Asia & Pacific (IDA & IBRD countries)Egypt, Arab Rep.El SalvadorEquatorial GuineaEstoniaEthiopiaEuro areaEurope & Central AsiaEurope & Central Asia (excluding high income)Europe & Central Asia (IDA & IBRD countries)European UnionFijiFinlandFranceGambia, TheGeorgiaGermanyGhanaGreeceGrenadaGuatemalaHeavily indebted poor countries (HIPC)High incomeHondurasHong Kong SAR, ChinaHungaryIBRD onlyIcelandIDA & IBRD totalIDA blendIDA onlyIDA totalIndiaIndonesiaIran, Islamic Rep.IraqIrelandIsraelItalyJamaicaJapanJordanKazakhstanKenyaKiribatiKorea, Rep.KuwaitKyrgyz RepublicLao PDRLate-demographic dividendLatin America & Caribbean Latin America & Caribbean (excluding high income)Latin America & the Caribbean (IDA & IBRD countries)LatviaLeast developed countries: UN classificationLebanonLesothoLiberiaLithuaniaLow & middle incomeLow incomeLower middle incomeLuxembourgMacao SAR, ChinaMacedonia, FYRMadagascarMalawiMalaysiaMaldivesMaliMaltaMauritiusMexicoMicronesia, Fed. Sts.Middle East & North AfricaMiddle East & North Africa (excluding high income)Middle East & North Africa (IDA & IBRD countries)Middle incomeMoldovaMongoliaMoroccoMozambiqueNamibiaNepalNetherlandsNew ZealandNicaraguaNigeriaNorth AmericaNorwayOECD membersOmanOther small statesPakistanPanamaPapua New GuineaParaguayPeruPhilippinesPolandPortugalPost-demographic dividendPre-demographic dividendQatarRomaniaRussian FederationRwandaSamoaSan MarinoSao Tome and PrincipeSenegalSerbiaSeychellesSierra LeoneSingaporeSlovak RepublicSloveniaSmall statesSolomon IslandsSouth AfricaSouth AsiaSouth Asia (IDA & IBRD)SpainSri LankaSt. Kitts and NevisSt. LuciaSub-Saharan Africa Sub-Saharan Africa (excluding high income)Sub-Saharan Africa (IDA & IBRD countries)SurinameSwazilandSwedenSwitzerlandSyrian Arab RepublicTajikistanTanzaniaThailandTimor-LesteTogoTrinidad and TobagoTunisiaTurkeyUgandaUkraineUnited Arab EmiratesUnited KingdomUnited StatesUpper middle incomeUruguayVanuatuVenezuela, RBWest Bank and GazaWorldYemen, Rep.ZambiaZimbabwe Timeline:
This timeline shows a graph from 1974 to 2015 of Post-demographic dividend. No data until 1973. Number of actual observations by date: 42.
Source name:
World Development Indicators
Source organization:
International Monetary Fund, Government Finance Statistics Yearbook and data files.
Categories, topics:
Public Sector
Last updated:
apr 23, 2017
Indicators value changes by year
Maximum:
16.288
jan 1, 1974
At the date of observation
Value
Absolute change
Change from previous value
jan 1, 1974
16.288
+16.288
0.0%
jan 1, 1975
15.061
-1.227
-7.53%
jan 1, 1976
14.494
-0.566
-3.76%
jan 1, 1977
14.0
-0.494
-3.41%
jan 1, 1978
13.117
-0.883
-6.31%
jan 1, 1979
10.932
-2.185
-16.66%
jan 1, 1980
10.335
-0.597
-5.46%
jan 1, 1981
11.377
+1.042
10.08%
jan 1, 1982
12.183
+0.807
7.09%
jan 1, 1983
12.803
+0.62
5.09%
jan 1, 1984
11.991
-0.812
-6.34%
jan 1, 1985
11.52
-0.472
-3.93%
jan 1, 1986
11.111
-0.408
-3.55%
jan 1, 1987
10.004
-1.108
-9.97%
jan 1, 1988
10.812
+0.809
8.08%
jan 1, 1989
10.548
-0.264
-2.44%
jan 1, 1990
11.287
+0.739
7.01%
jan 1, 1991
11.657
+0.37
3.28%
jan 1, 1992
10.446
-1.211
-10.39%
jan 1, 1993
12.335
+1.889
18.09%
jan 1, 1994
15.421
+3.086
25.02%
jan 1, 1995
12.422
-2.999
-19.45%
jan 1, 1996
8.373
-4.05
-32.6%
jan 1, 1997
7.464
-0.909
-10.85%
jan 1, 1998
8.365
+0.901
12.07%
jan 1, 1999
8.118
-0.247
-2.95%
jan 1, 2000
8.653
+0.535
6.59%
jan 1, 2001
8.849
+0.196
2.27%
jan 1, 2002
8.629
-0.22
-2.49%
jan 1, 2003
8.666
+0.036
0.42%
jan 1, 2004
8.604
-0.061
-0.71%
jan 1, 2005
8.729
+0.124
1.44%
jan 1, 2006
8.741
+0.013
0.15%
jan 1, 2007
9.136
+0.394
4.51%
jan 1, 2008
9.208
+0.072
0.79%
jan 1, 2009
9.185
-0.023
-0.25%
jan 1, 2010
9.277
+0.092
1.0%
jan 1, 2011
9.05
-0.228
-2.45%
jan 1, 2012
8.093
-0.956
-10.57%
jan 1, 2013
8.434
+0.341
4.21%
jan 1, 2014
7.973
-0.461
-5.47%
jan 1, 2015
8.054
+0.081
1.01%
Ranking of countries by current statistics by years


Comments: