29
/
en
AIzaSyAYiBZKx7MnpbEhh9jyipgxe19OcubqV5w
April 1, 2024
133176
Finland
FIN
true
2
1
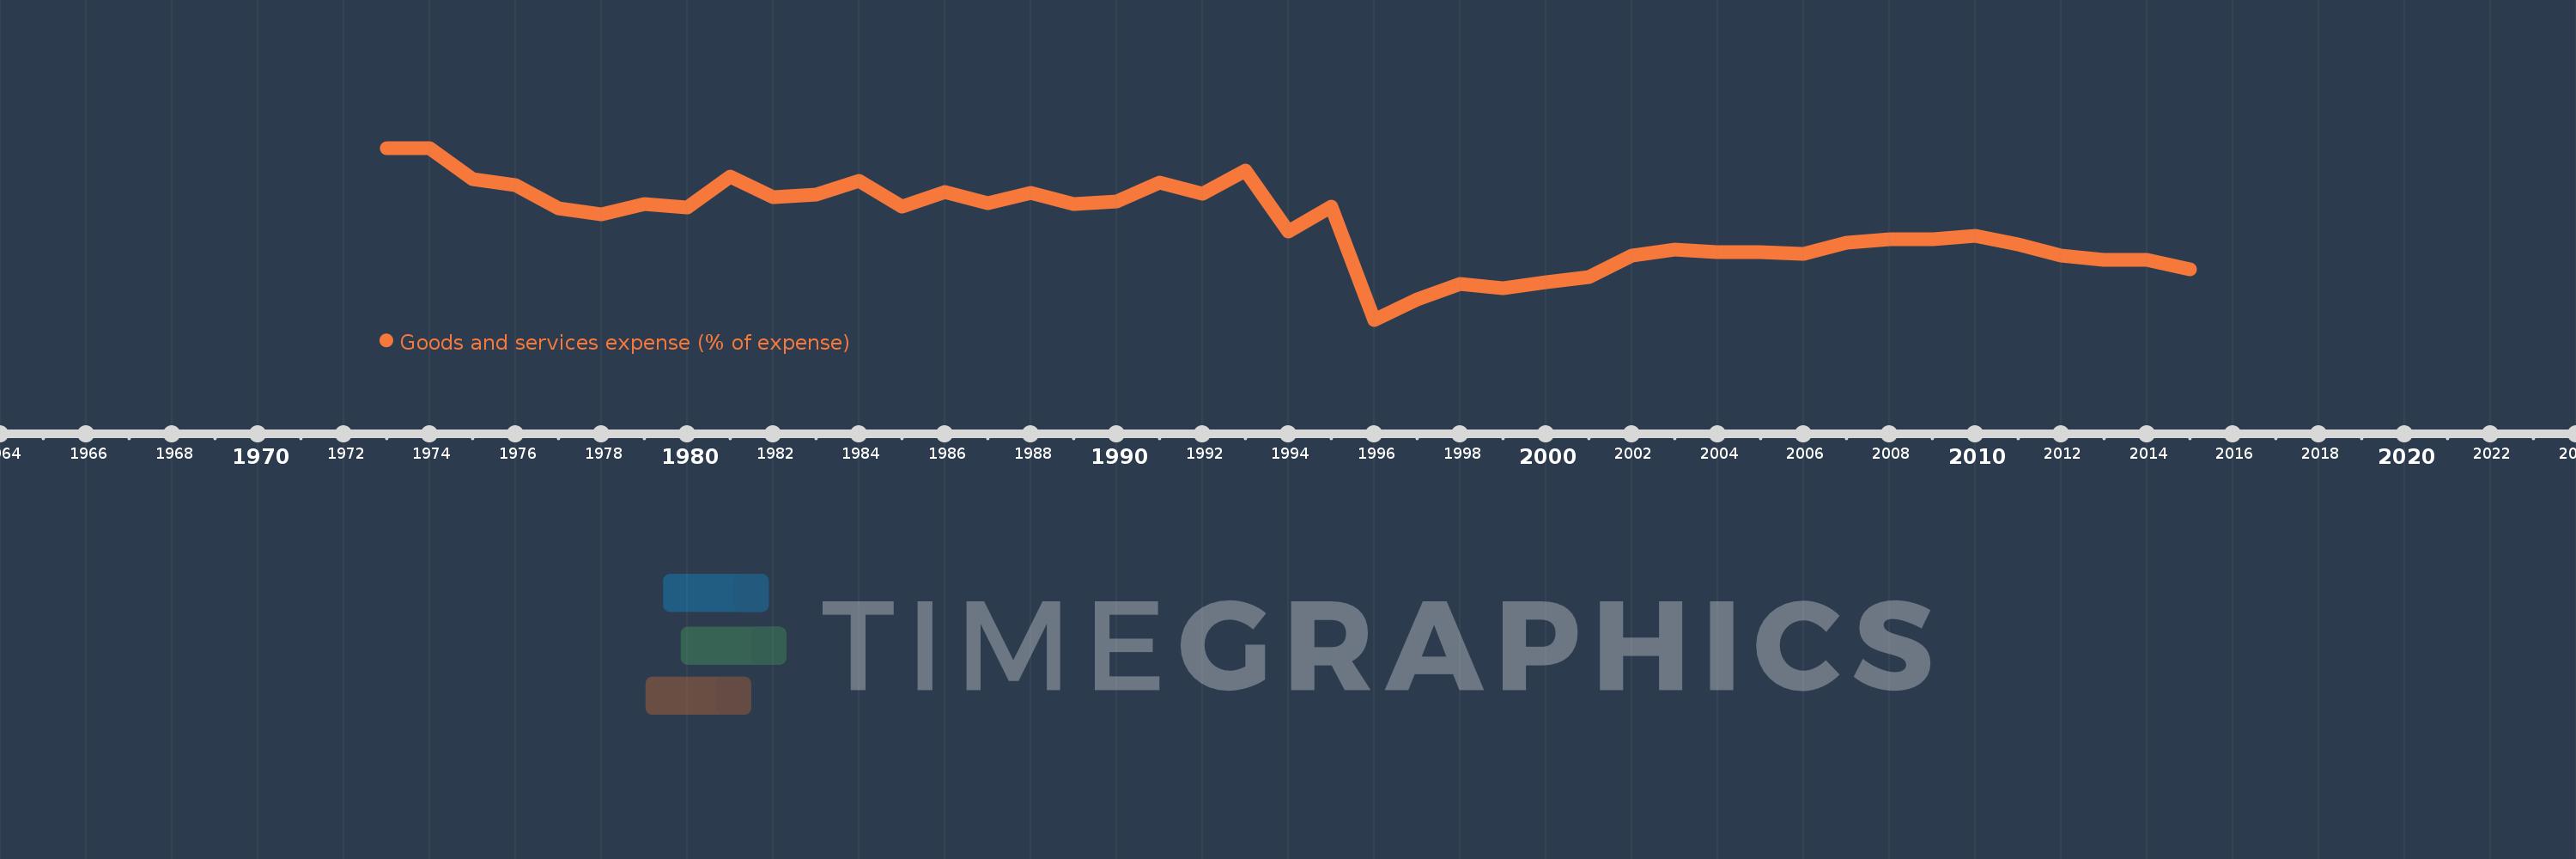
Goods and services expense (% of expense)
2015,2014,2013,2012,2011,2010,2009,2008,2007,2006,2005,2004,2003,2002,2001,2000,1999,1998,1997,1996,1995,1994,1993,1992,1991,1990,1989,1988,1987,1986,1985,1984,1983,1982,1981,1980,1979,1978,1977,1976,1975,1974,1973
This statistics in other country:
AfghanistanAlbaniaAlgeriaAngolaAntigua and BarbudaArab WorldArmeniaAustraliaAustriaAzerbaijanBahamas, TheBahrainBangladeshBarbadosBelarusBelgiumBelizeBeninBhutanBoliviaBosnia and HerzegovinaBotswanaBrazilBulgariaBurkina FasoBurundiCabo VerdeCambodiaCanadaCaribbean small statesCentral African RepublicCentral Europe and the BalticsChileColombiaCongo, Dem. Rep.Congo, Rep.Costa RicaCote d'IvoireCroatiaCyprusCzech RepublicDenmarkDominicaDominican RepublicEarly-demographic dividendEast Asia & PacificEast Asia & Pacific (excluding high income)East Asia & Pacific (IDA & IBRD countries)Egypt, Arab Rep.El SalvadorEquatorial GuineaEstoniaEthiopiaEuro areaEurope & Central AsiaEurope & Central Asia (excluding high income)Europe & Central Asia (IDA & IBRD countries)European UnionFijiFinlandFranceGambia, TheGeorgiaGermanyGhanaGreeceGrenadaGuatemalaHeavily indebted poor countries (HIPC)High incomeHondurasHong Kong SAR, ChinaHungaryIBRD onlyIcelandIDA & IBRD totalIDA blendIDA onlyIDA totalIndiaIndonesiaIran, Islamic Rep.IraqIrelandIsraelItalyJamaicaJapanJordanKazakhstanKenyaKiribatiKorea, Rep.KuwaitKyrgyz RepublicLao PDRLate-demographic dividendLatin America & Caribbean Latin America & Caribbean (excluding high income)Latin America & the Caribbean (IDA & IBRD countries)LatviaLeast developed countries: UN classificationLebanonLesothoLiberiaLithuaniaLow & middle incomeLow incomeLower middle incomeLuxembourgMacao SAR, ChinaMacedonia, FYRMadagascarMalawiMalaysiaMaldivesMaliMaltaMauritiusMexicoMicronesia, Fed. Sts.Middle East & North AfricaMiddle East & North Africa (excluding high income)Middle East & North Africa (IDA & IBRD countries)Middle incomeMoldovaMongoliaMoroccoMozambiqueNamibiaNepalNetherlandsNew ZealandNicaraguaNigeriaNorth AmericaNorwayOECD membersOmanOther small statesPakistanPanamaPapua New GuineaParaguayPeruPhilippinesPolandPortugalPost-demographic dividendPre-demographic dividendQatarRomaniaRussian FederationRwandaSamoaSan MarinoSao Tome and PrincipeSenegalSerbiaSeychellesSierra LeoneSingaporeSlovak RepublicSloveniaSmall statesSolomon IslandsSouth AfricaSouth AsiaSouth Asia (IDA & IBRD)SpainSri LankaSt. Kitts and NevisSt. LuciaSub-Saharan Africa Sub-Saharan Africa (excluding high income)Sub-Saharan Africa (IDA & IBRD countries)SurinameSwazilandSwedenSwitzerlandSyrian Arab RepublicTajikistanTanzaniaThailandTimor-LesteTogoTrinidad and TobagoTunisiaTurkeyUgandaUkraineUnited Arab EmiratesUnited KingdomUnited StatesUpper middle incomeUruguayVanuatuVenezuela, RBWest Bank and GazaWorldYemen, Rep.ZambiaZimbabwe Timeline:
This timeline shows a graph from 1973 to 2015 of Finland. No data until 1972. Number of actual observations by date: 43.
Source name:
World Development Indicators
Source organization:
International Monetary Fund, Government Finance Statistics Yearbook and data files.
Categories, topics:
Public Sector
Last updated:
apr 23, 2017
Indicators value changes by year
Maximum:
11.848
jan 1, 1974
At the date of observation
Value
Absolute change
Change from previous value
jan 1, 1973
11.846
+11.846
0.0%
jan 1, 1974
11.848
+0.002
0.02%
jan 1, 1975
10.938
-0.911
-7.69%
jan 1, 1976
10.758
-0.18
-1.64%
jan 1, 1977
10.106
-0.652
-6.06%
jan 1, 1978
9.926
-0.18
-1.78%
jan 1, 1979
10.229
+0.304
3.06%
jan 1, 1980
10.118
-0.112
-1.09%
jan 1, 1981
11.014
+0.897
8.86%
jan 1, 1982
10.42
-0.595
-5.4%
jan 1, 1983
10.505
+0.085
0.82%
jan 1, 1984
10.904
+0.399
3.8%
jan 1, 1985
10.135
-0.769
-7.05%
jan 1, 1986
10.563
+0.428
4.23%
jan 1, 1987
10.237
-0.326
-3.08%
jan 1, 1988
10.546
+0.308
3.01%
jan 1, 1989
10.216
-0.329
-3.12%
jan 1, 1990
10.296
+0.079
0.78%
jan 1, 1991
10.843
+0.547
5.31%
jan 1, 1992
10.514
-0.328
-3.03%
jan 1, 1993
11.181
+0.667
6.34%
jan 1, 1994
9.432
-1.749
-15.64%
jan 1, 1995
10.147
+0.715
7.58%
jan 1, 1996
6.863
-3.283
-32.36%
jan 1, 1997
7.464
+0.601
8.75%
jan 1, 1998
7.894
+0.43
5.76%
jan 1, 1999
7.766
-0.128
-1.62%
jan 1, 2000
7.962
+0.196
2.52%
jan 1, 2001
8.096
+0.134
1.69%
jan 1, 2002
8.731
+0.635
7.85%
jan 1, 2003
8.896
+0.164
1.88%
jan 1, 2004
8.819
-0.077
-0.86%
jan 1, 2005
8.831
+0.012
0.14%
jan 1, 2006
8.77
-0.06
-0.68%
jan 1, 2007
9.089
+0.319
3.63%
jan 1, 2008
9.204
+0.114
1.26%
jan 1, 2009
9.194
-0.009
-0.1%
jan 1, 2010
9.288
+0.094
1.02%
jan 1, 2011
9.05
-0.239
-2.57%
jan 1, 2012
8.722
-0.328
-3.62%
jan 1, 2013
8.598
-0.124
-1.42%
jan 1, 2014
8.59
-0.009
-0.1%
jan 1, 2015
8.335
-0.254
-2.96%
Ranking of countries by current statistics by years


Comments: