29
/
en
AIzaSyAYiBZKx7MnpbEhh9jyipgxe19OcubqV5w
April 1, 2024
222216
Peru
PER
true
2
1
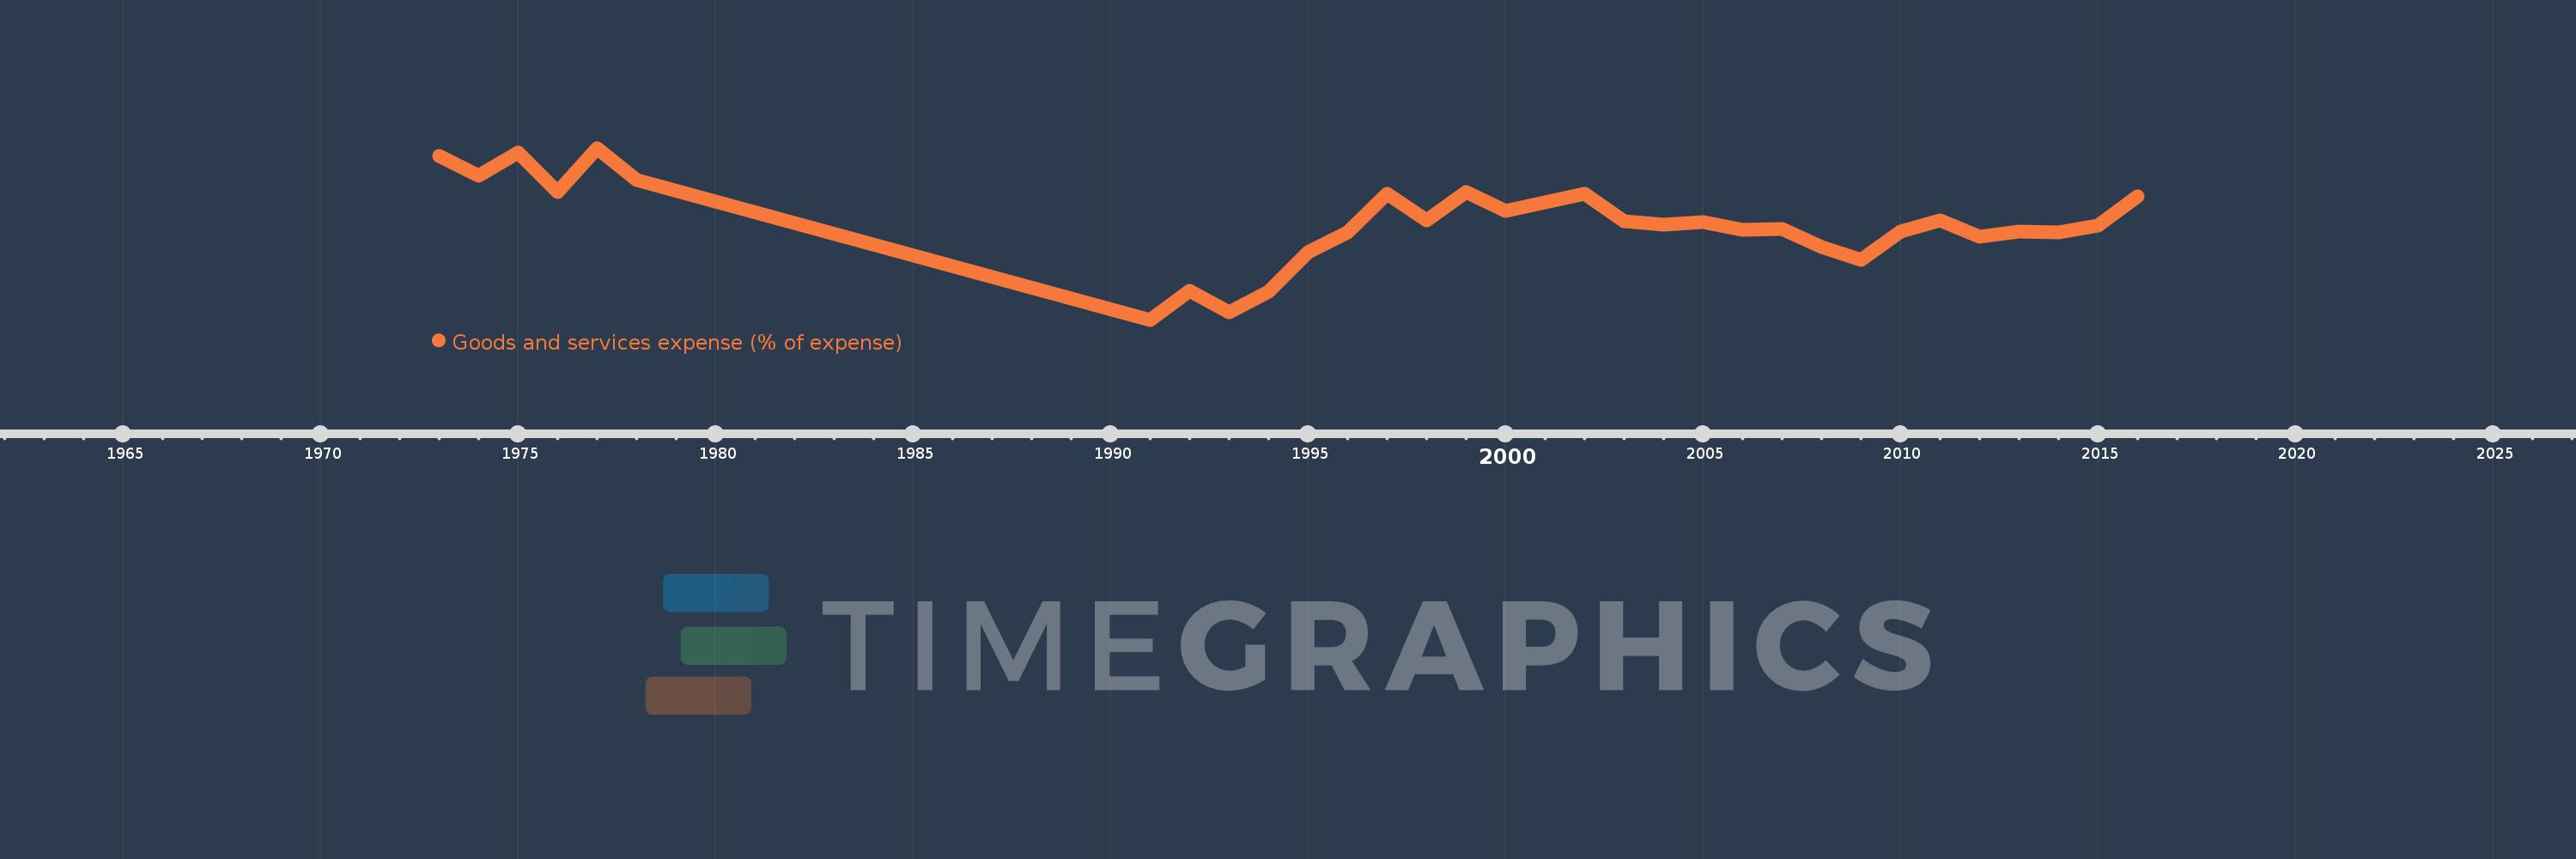
Goods and services expense (% of expense)
2016,2015,2014,2013,2012,2011,2010,2009,2008,2007,2006,2005,2004,2003,2002,2001,2000,1999,1998,1997,1996,1995,1994,1993,1992,1991,1978,1977,1976,1975,1974,1973
This statistics in other country:
AfghanistanAlbaniaAlgeriaAngolaAntigua and BarbudaArab WorldArmeniaAustraliaAustriaAzerbaijanBahamas, TheBahrainBangladeshBarbadosBelarusBelgiumBelizeBeninBhutanBoliviaBosnia and HerzegovinaBotswanaBrazilBulgariaBurkina FasoBurundiCabo VerdeCambodiaCanadaCaribbean small statesCentral African RepublicCentral Europe and the BalticsChileColombiaCongo, Dem. Rep.Congo, Rep.Costa RicaCote d'IvoireCroatiaCyprusCzech RepublicDenmarkDominicaDominican RepublicEarly-demographic dividendEast Asia & PacificEast Asia & Pacific (excluding high income)East Asia & Pacific (IDA & IBRD countries)Egypt, Arab Rep.El SalvadorEquatorial GuineaEstoniaEthiopiaEuro areaEurope & Central AsiaEurope & Central Asia (excluding high income)Europe & Central Asia (IDA & IBRD countries)European UnionFijiFinlandFranceGambia, TheGeorgiaGermanyGhanaGreeceGrenadaGuatemalaHeavily indebted poor countries (HIPC)High incomeHondurasHong Kong SAR, ChinaHungaryIBRD onlyIcelandIDA & IBRD totalIDA blendIDA onlyIDA totalIndiaIndonesiaIran, Islamic Rep.IraqIrelandIsraelItalyJamaicaJapanJordanKazakhstanKenyaKiribatiKorea, Rep.KuwaitKyrgyz RepublicLao PDRLate-demographic dividendLatin America & Caribbean Latin America & Caribbean (excluding high income)Latin America & the Caribbean (IDA & IBRD countries)LatviaLeast developed countries: UN classificationLebanonLesothoLiberiaLithuaniaLow & middle incomeLow incomeLower middle incomeLuxembourgMacao SAR, ChinaMacedonia, FYRMadagascarMalawiMalaysiaMaldivesMaliMaltaMauritiusMexicoMicronesia, Fed. Sts.Middle East & North AfricaMiddle East & North Africa (excluding high income)Middle East & North Africa (IDA & IBRD countries)Middle incomeMoldovaMongoliaMoroccoMozambiqueNamibiaNepalNetherlandsNew ZealandNicaraguaNigeriaNorth AmericaNorwayOECD membersOmanOther small statesPakistanPanamaPapua New GuineaParaguayPeruPhilippinesPolandPortugalPost-demographic dividendPre-demographic dividendQatarRomaniaRussian FederationRwandaSamoaSan MarinoSao Tome and PrincipeSenegalSerbiaSeychellesSierra LeoneSingaporeSlovak RepublicSloveniaSmall statesSolomon IslandsSouth AfricaSouth AsiaSouth Asia (IDA & IBRD)SpainSri LankaSt. Kitts and NevisSt. LuciaSub-Saharan Africa Sub-Saharan Africa (excluding high income)Sub-Saharan Africa (IDA & IBRD countries)SurinameSwazilandSwedenSwitzerlandSyrian Arab RepublicTajikistanTanzaniaThailandTimor-LesteTogoTrinidad and TobagoTunisiaTurkeyUgandaUkraineUnited Arab EmiratesUnited KingdomUnited StatesUpper middle incomeUruguayVanuatuVenezuela, RBWest Bank and GazaWorldYemen, Rep.ZambiaZimbabwe Timeline:
This timeline shows a graph from 1973 to 2016 of Peru. No data until 1972. Number of actual observations by date: 32.
Source name:
World Development Indicators
Source organization:
International Monetary Fund, Government Finance Statistics Yearbook and data files.
Categories, topics:
Public Sector
Last updated:
apr 23, 2017
Indicators value changes by year
Minimum:
12.944
jan 1, 1991
Maximum:
27.344
jan 1, 1977
At the date of observation
Value
Absolute change
Change from previous value
jan 1, 1973
26.667
+26.667
0.0%
jan 1, 1974
25.0
-1.667
-6.25%
jan 1, 1975
26.984
+1.984
7.94%
jan 1, 1976
23.656
-3.328
-12.33%
jan 1, 1977
27.344
+3.688
15.59%
jan 1, 1978
24.691
-2.652
-9.7%
jan 1, 1991
12.944
-11.747
-47.58%
jan 1, 1992
15.339
+2.395
18.5%
jan 1, 1993
13.558
-1.781
-11.61%
jan 1, 1994
15.32
+1.762
13.0%
jan 1, 1995
18.598
+3.278
21.4%
jan 1, 1996
20.244
+1.646
8.85%
jan 1, 1997
23.479
+3.235
15.98%
jan 1, 1998
21.298
-2.182
-9.29%
jan 1, 1999
23.65
+2.353
11.05%
jan 1, 2000
22.071
-1.58
-6.68%
jan 1, 2001
22.796
+0.726
3.29%
jan 1, 2002
23.537
+0.74
3.25%
jan 1, 2003
21.181
-2.356
-10.01%
jan 1, 2004
20.902
-0.28
-1.32%
jan 1, 2005
21.119
+0.217
1.04%
jan 1, 2006
20.479
-0.64
-3.03%
jan 1, 2007
20.589
+0.109
0.53%
jan 1, 2008
19.078
-1.511
-7.34%
jan 1, 2009
17.938
-1.14
-5.97%
jan 1, 2010
20.363
+2.425
13.52%
jan 1, 2011
21.276
+0.913
4.48%
jan 1, 2012
19.918
-1.358
-6.38%
jan 1, 2013
20.366
+0.448
2.25%
jan 1, 2014
20.289
-0.077
-0.38%
jan 1, 2015
20.867
+0.579
2.85%
jan 1, 2016
23.262
+2.395
11.48%
Ranking of countries by current statistics by years


Comments: