29
/
en
AIzaSyAYiBZKx7MnpbEhh9jyipgxe19OcubqV5w
April 1, 2024
269361
Turkey
TUR
true
2
1
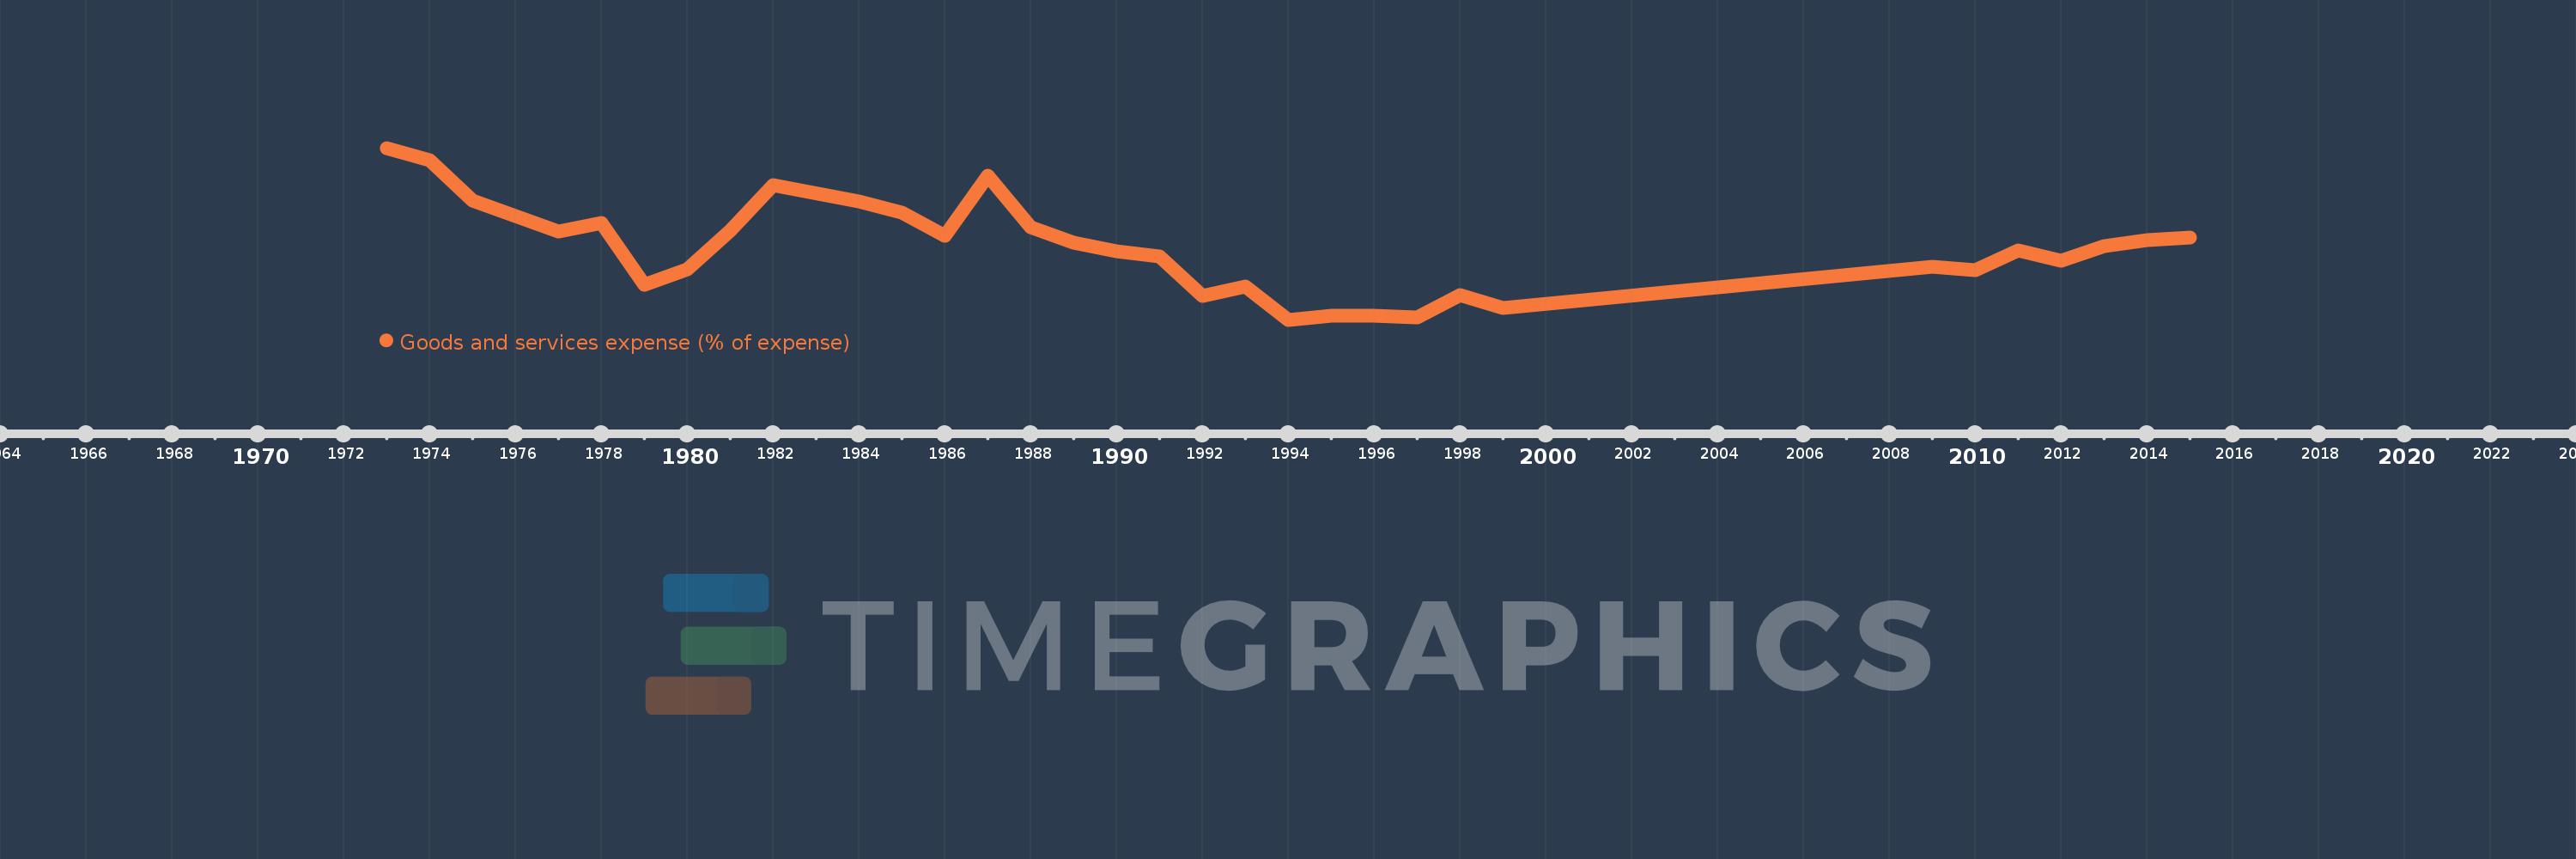
Goods and services expense (% of expense)
2015,2014,2013,2012,2011,2010,2009,1999,1998,1997,1996,1995,1994,1993,1992,1991,1990,1989,1988,1987,1986,1985,1984,1982,1981,1980,1979,1978,1977,1976,1975,1974,1973
This statistics in other country:
AfghanistanAlbaniaAlgeriaAngolaAntigua and BarbudaArab WorldArmeniaAustraliaAustriaAzerbaijanBahamas, TheBahrainBangladeshBarbadosBelarusBelgiumBelizeBeninBhutanBoliviaBosnia and HerzegovinaBotswanaBrazilBulgariaBurkina FasoBurundiCabo VerdeCambodiaCanadaCaribbean small statesCentral African RepublicCentral Europe and the BalticsChileColombiaCongo, Dem. Rep.Congo, Rep.Costa RicaCote d'IvoireCroatiaCyprusCzech RepublicDenmarkDominicaDominican RepublicEarly-demographic dividendEast Asia & PacificEast Asia & Pacific (excluding high income)East Asia & Pacific (IDA & IBRD countries)Egypt, Arab Rep.El SalvadorEquatorial GuineaEstoniaEthiopiaEuro areaEurope & Central AsiaEurope & Central Asia (excluding high income)Europe & Central Asia (IDA & IBRD countries)European UnionFijiFinlandFranceGambia, TheGeorgiaGermanyGhanaGreeceGrenadaGuatemalaHeavily indebted poor countries (HIPC)High incomeHondurasHong Kong SAR, ChinaHungaryIBRD onlyIcelandIDA & IBRD totalIDA blendIDA onlyIDA totalIndiaIndonesiaIran, Islamic Rep.IraqIrelandIsraelItalyJamaicaJapanJordanKazakhstanKenyaKiribatiKorea, Rep.KuwaitKyrgyz RepublicLao PDRLate-demographic dividendLatin America & Caribbean Latin America & Caribbean (excluding high income)Latin America & the Caribbean (IDA & IBRD countries)LatviaLeast developed countries: UN classificationLebanonLesothoLiberiaLithuaniaLow & middle incomeLow incomeLower middle incomeLuxembourgMacao SAR, ChinaMacedonia, FYRMadagascarMalawiMalaysiaMaldivesMaliMaltaMauritiusMexicoMicronesia, Fed. Sts.Middle East & North AfricaMiddle East & North Africa (excluding high income)Middle East & North Africa (IDA & IBRD countries)Middle incomeMoldovaMongoliaMoroccoMozambiqueNamibiaNepalNetherlandsNew ZealandNicaraguaNigeriaNorth AmericaNorwayOECD membersOmanOther small statesPakistanPanamaPapua New GuineaParaguayPeruPhilippinesPolandPortugalPost-demographic dividendPre-demographic dividendQatarRomaniaRussian FederationRwandaSamoaSan MarinoSao Tome and PrincipeSenegalSerbiaSeychellesSierra LeoneSingaporeSlovak RepublicSloveniaSmall statesSolomon IslandsSouth AfricaSouth AsiaSouth Asia (IDA & IBRD)SpainSri LankaSt. Kitts and NevisSt. LuciaSub-Saharan Africa Sub-Saharan Africa (excluding high income)Sub-Saharan Africa (IDA & IBRD countries)SurinameSwazilandSwedenSwitzerlandSyrian Arab RepublicTajikistanTanzaniaThailandTimor-LesteTogoTrinidad and TobagoTunisiaTurkeyUgandaUkraineUnited Arab EmiratesUnited KingdomUnited StatesUpper middle incomeUruguayVanuatuVenezuela, RBWest Bank and GazaWorldYemen, Rep.ZambiaZimbabwe Timeline:
This timeline shows a graph from 1973 to 2015 of Turkey. No data until 1972. Number of actual observations by date: 33.
Source name:
World Development Indicators
Source organization:
International Monetary Fund, Government Finance Statistics Yearbook and data files.
Categories, topics:
Public Sector
Last updated:
apr 23, 2017
Indicators value changes by year
Maximum:
18.329
jan 1, 1973
At the date of observation
Value
Absolute change
Change from previous value
jan 1, 1973
18.329
+18.329
0.0%
jan 1, 1974
17.604
-0.725
-3.96%
jan 1, 1975
15.107
-2.498
-14.19%
jan 1, 1976
14.177
-0.93
-6.16%
jan 1, 1977
13.201
-0.976
-6.88%
jan 1, 1978
13.734
+0.533
4.03%
jan 1, 1979
9.961
-3.773
-27.47%
jan 1, 1980
10.921
+0.96
9.64%
jan 1, 1981
13.28
+2.359
21.6%
jan 1, 1982
16.072
+2.793
21.03%
jan 1, 1984
15.063
-1.01
-6.28%
jan 1, 1985
14.4
-0.663
-4.4%
jan 1, 1986
12.967
-1.433
-9.95%
jan 1, 1987
16.655
+3.689
28.45%
jan 1, 1988
13.498
-3.157
-18.96%
jan 1, 1989
12.522
-0.976
-7.23%
jan 1, 1990
12.015
-0.508
-4.05%
jan 1, 1991
11.687
-0.328
-2.73%
jan 1, 1992
9.298
-2.389
-20.44%
jan 1, 1993
9.855
+0.557
5.99%
jan 1, 1994
7.837
-2.018
-20.48%
jan 1, 1995
8.08
+0.244
3.11%
jan 1, 1996
8.081
+0.0
0.0%
jan 1, 1997
8.004
-0.076
-0.94%
jan 1, 1998
9.336
+1.332
16.64%
jan 1, 1999
8.553
-0.783
-8.38%
jan 1, 2009
11.049
+2.496
29.18%
jan 1, 2010
10.872
-0.177
-1.6%
jan 1, 2011
12.08
+1.207
11.1%
jan 1, 2012
11.453
-0.627
-5.19%
jan 1, 2013
12.318
+0.865
7.55%
jan 1, 2014
12.713
+0.394
3.2%
jan 1, 2015
12.862
+0.149
1.18%
Ranking of countries by current statistics by years


Comments: