29
/
en
AIzaSyAYiBZKx7MnpbEhh9jyipgxe19OcubqV5w
April 1, 2024
76030
Bahamas, The
BHS
true
2
1
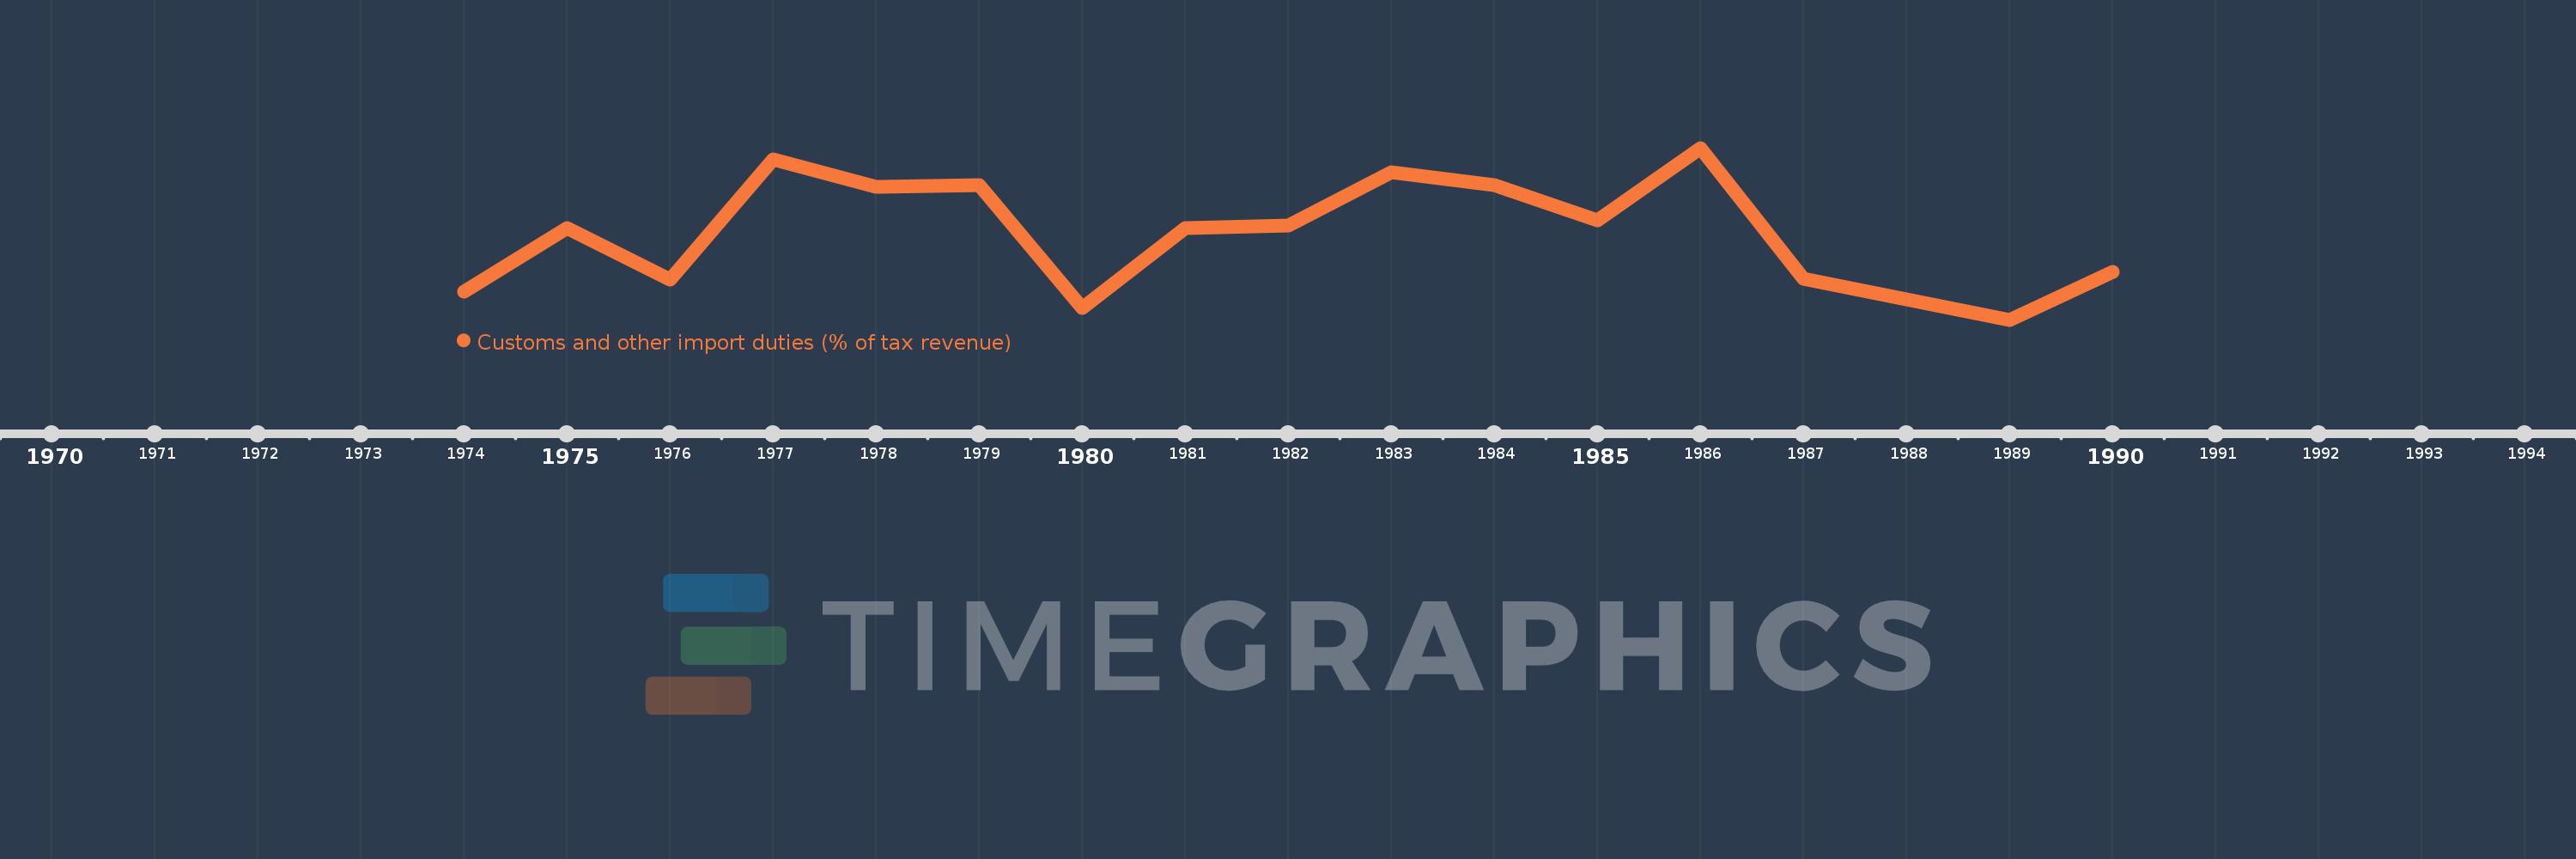
Customs and other import duties (% of tax revenue)
1990,1989,1987,1986,1985,1984,1983,1982,1981,1980,1979,1978,1977,1976,1975,1974
This statistics in other country:
AfghanistanAlbaniaAlgeriaAngolaAntigua and BarbudaArgentinaArmeniaAustraliaAustriaAzerbaijanBahamas, TheBahrainBangladeshBarbadosBelarusBelizeBeninBhutanBoliviaBosnia and HerzegovinaBotswanaBrazilBulgariaBurkina FasoBurundiCabo VerdeCambodiaCentral African RepublicChileChinaColombiaCongo, Dem. Rep.Congo, Rep.Costa RicaCote d'IvoireCroatiaCyprusCzech RepublicDenmarkDominicaDominican RepublicEgypt, Arab Rep.El SalvadorEquatorial GuineaEstoniaEthiopiaFijiFinlandFranceGambia, TheGeorgiaGermanyGhanaGreeceGrenadaGuatemalaHondurasHong Kong SAR, ChinaHungaryIcelandIndiaIndonesiaIran, Islamic Rep.IraqIrelandIsraelItalyJamaicaJapanJordanKazakhstanKenyaKiribatiKorea, Rep.KuwaitKyrgyz RepublicLao PDRLatviaLebanonLiberiaLithuaniaLuxembourgMacedonia, FYRMadagascarMalawiMalaysiaMaldivesMaliMaltaMauritiusMexicoMicronesia, Fed. Sts.MoldovaMongoliaMoroccoMozambiqueMyanmarNamibiaNepalNetherlandsNew ZealandNicaraguaNorwayOmanPakistanPanamaPapua New GuineaParaguayPeruPhilippinesPolandPortugalQatarRomaniaRussian FederationRwandaSamoaSan MarinoSao Tome and PrincipeSenegalSerbiaSeychellesSierra LeoneSingaporeSlovak RepublicSloveniaSolomon IslandsSouth AfricaSpainSri LankaSt. Kitts and NevisSt. LuciaSurinameSwazilandSwedenSwitzerlandSyrian Arab RepublicTajikistanTanzaniaThailandTogoTrinidad and TobagoTunisiaTurkeyUgandaUkraineUnited Arab EmiratesUnited KingdomUnited StatesUruguayVanuatuVenezuela, RBVietnamWest Bank and GazaYemen, Rep.ZambiaZimbabwe Timeline:
This timeline shows a graph from 1974 to 1990 of Bahamas, The. No data until 1973. Number of actual observations by date: 16.
Source name:
World Development Indicators
Source organization:
International Monetary Fund, Government Finance Statistics Yearbook and data files.
Categories, topics:
Public Sector, Trade
Last updated:
apr 23, 2017
Indicators value changes by year
Minimum:
70.194
jan 1, 1989
Maximum:
75.793
jan 1, 1986
At the date of observation
Value
Absolute change
Change from previous value
jan 1, 1974
71.12
+71.12
0.0%
jan 1, 1975
73.182
+2.062
2.9%
jan 1, 1976
71.502
-1.68
-2.3%
jan 1, 1977
75.429
+3.927
5.49%
jan 1, 1978
74.515
-0.914
-1.21%
jan 1, 1979
74.575
+0.06
0.08%
jan 1, 1980
70.575
-4.0
-5.36%
jan 1, 1981
73.173
+2.598
3.68%
jan 1, 1982
73.26
+0.087
0.12%
jan 1, 1983
75.0
+1.74
2.38%
jan 1, 1984
74.593
-0.407
-0.54%
jan 1, 1985
73.432
-1.162
-1.56%
jan 1, 1986
75.793
+2.361
3.22%
jan 1, 1987
71.517
-4.276
-5.64%
jan 1, 1989
70.194
-1.323
-1.85%
jan 1, 1990
71.765
+1.571
2.24%
Ranking of countries by current statistics by years


Comments: