29
/
en
AIzaSyAYiBZKx7MnpbEhh9jyipgxe19OcubqV5w
April 1, 2024
239146
Sierra Leone
SLE
true
2
1
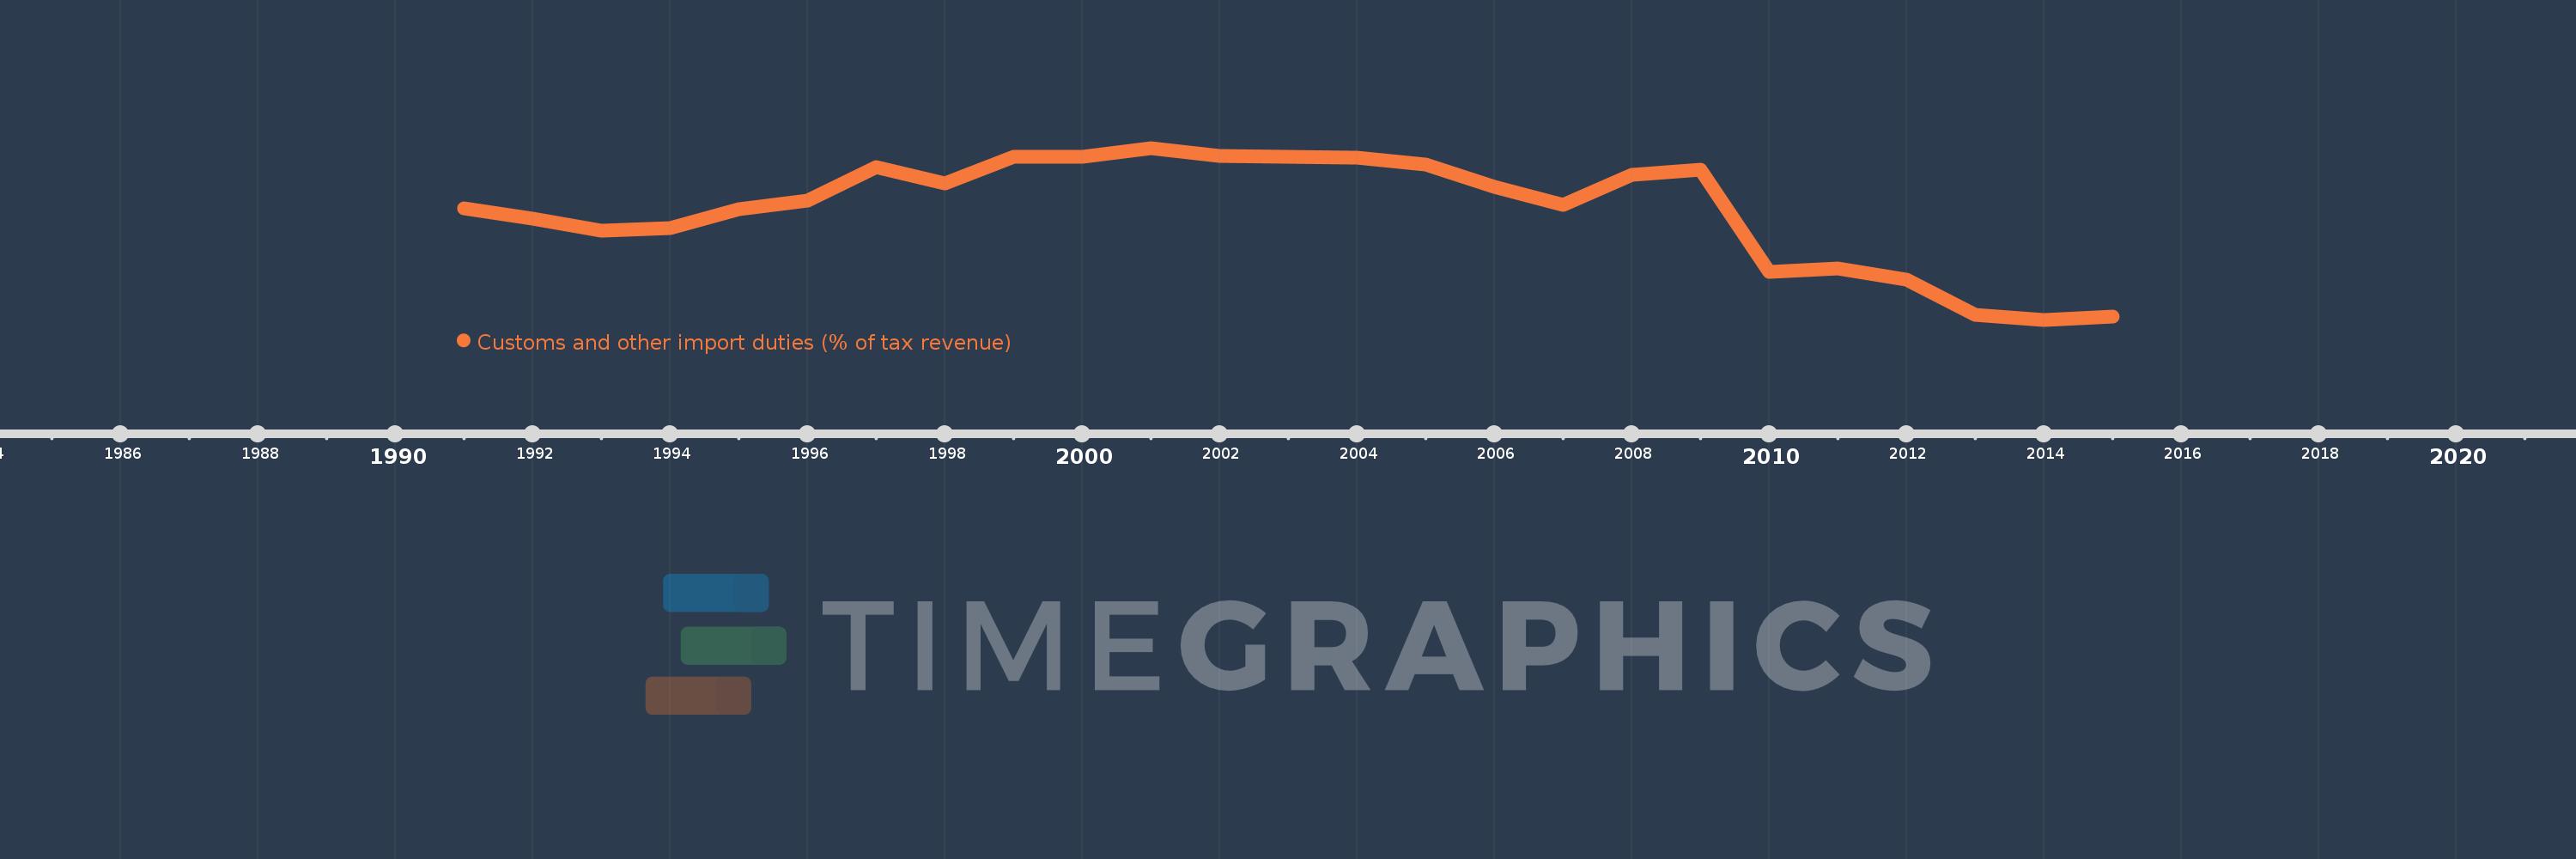
Customs and other import duties (% of tax revenue)
2015,2014,2013,2012,2011,2010,2009,2008,2007,2006,2005,2004,2003,2002,2001,2000,1999,1998,1997,1996,1995,1994,1993,1992,1991
This statistics in other country:
AfghanistanAlbaniaAlgeriaAngolaAntigua and BarbudaArgentinaArmeniaAustraliaAustriaAzerbaijanBahamas, TheBahrainBangladeshBarbadosBelarusBelizeBeninBhutanBoliviaBosnia and HerzegovinaBotswanaBrazilBulgariaBurkina FasoBurundiCabo VerdeCambodiaCentral African RepublicChileChinaColombiaCongo, Dem. Rep.Congo, Rep.Costa RicaCote d'IvoireCroatiaCyprusCzech RepublicDenmarkDominicaDominican RepublicEgypt, Arab Rep.El SalvadorEquatorial GuineaEstoniaEthiopiaFijiFinlandFranceGambia, TheGeorgiaGermanyGhanaGreeceGrenadaGuatemalaHondurasHong Kong SAR, ChinaHungaryIcelandIndiaIndonesiaIran, Islamic Rep.IraqIrelandIsraelItalyJamaicaJapanJordanKazakhstanKenyaKiribatiKorea, Rep.KuwaitKyrgyz RepublicLao PDRLatviaLebanonLiberiaLithuaniaLuxembourgMacedonia, FYRMadagascarMalawiMalaysiaMaldivesMaliMaltaMauritiusMexicoMicronesia, Fed. Sts.MoldovaMongoliaMoroccoMozambiqueMyanmarNamibiaNepalNetherlandsNew ZealandNicaraguaNorwayOmanPakistanPanamaPapua New GuineaParaguayPeruPhilippinesPolandPortugalQatarRomaniaRussian FederationRwandaSamoaSan MarinoSao Tome and PrincipeSenegalSerbiaSeychellesSierra LeoneSingaporeSlovak RepublicSloveniaSolomon IslandsSouth AfricaSpainSri LankaSt. Kitts and NevisSt. LuciaSurinameSwazilandSwedenSwitzerlandSyrian Arab RepublicTajikistanTanzaniaThailandTogoTrinidad and TobagoTunisiaTurkeyUgandaUkraineUnited Arab EmiratesUnited KingdomUnited StatesUruguayVanuatuVenezuela, RBVietnamWest Bank and GazaYemen, Rep.ZambiaZimbabwe Timeline:
This timeline shows a graph from 1991 to 2015 of Sierra Leone. No data until 1990. Number of actual observations by date: 25.
Source name:
World Development Indicators
Source organization:
International Monetary Fund, Government Finance Statistics Yearbook and data files.
Categories, topics:
Public Sector, Trade
Last updated:
apr 23, 2017
Indicators value changes by year
Minimum:
13.823
jan 1, 2014
Maximum:
56.166
jan 1, 2001
At the date of observation
Value
Absolute change
Change from previous value
jan 1, 1991
41.277
+41.277
0.0%
jan 1, 1992
38.685
-2.592
-6.28%
jan 1, 1993
35.857
-2.829
-7.31%
jan 1, 1994
36.395
+0.538
1.5%
jan 1, 1995
40.994
+4.599
12.64%
jan 1, 1996
43.246
+2.252
5.49%
jan 1, 1997
51.465
+8.219
19.0%
jan 1, 1998
47.422
-4.042
-7.85%
jan 1, 1999
53.933
+6.511
13.73%
jan 1, 2000
53.902
-0.031
-0.06%
jan 1, 2001
56.166
+2.265
4.2%
jan 1, 2002
54.251
-1.915
-3.41%
jan 1, 2003
54.013
-0.238
-0.44%
jan 1, 2004
53.801
-0.212
-0.39%
jan 1, 2005
52.037
-1.765
-3.28%
jan 1, 2006
46.514
-5.523
-10.61%
jan 1, 2007
42.024
-4.49
-9.65%
jan 1, 2008
49.615
+7.59
18.06%
jan 1, 2009
50.899
+1.285
2.59%
jan 1, 2010
25.681
-25.218
-49.55%
jan 1, 2011
26.431
+0.75
2.92%
jan 1, 2012
23.707
-2.723
-10.3%
jan 1, 2013
15.076
-8.631
-36.41%
jan 1, 2014
13.823
-1.253
-8.31%
jan 1, 2015
14.616
+0.793
5.74%
Ranking of countries by current statistics by years


Comments: