29
/
en
AIzaSyAYiBZKx7MnpbEhh9jyipgxe19OcubqV5w
April 1, 2024
210203
Nicaragua
NIC
true
2
1
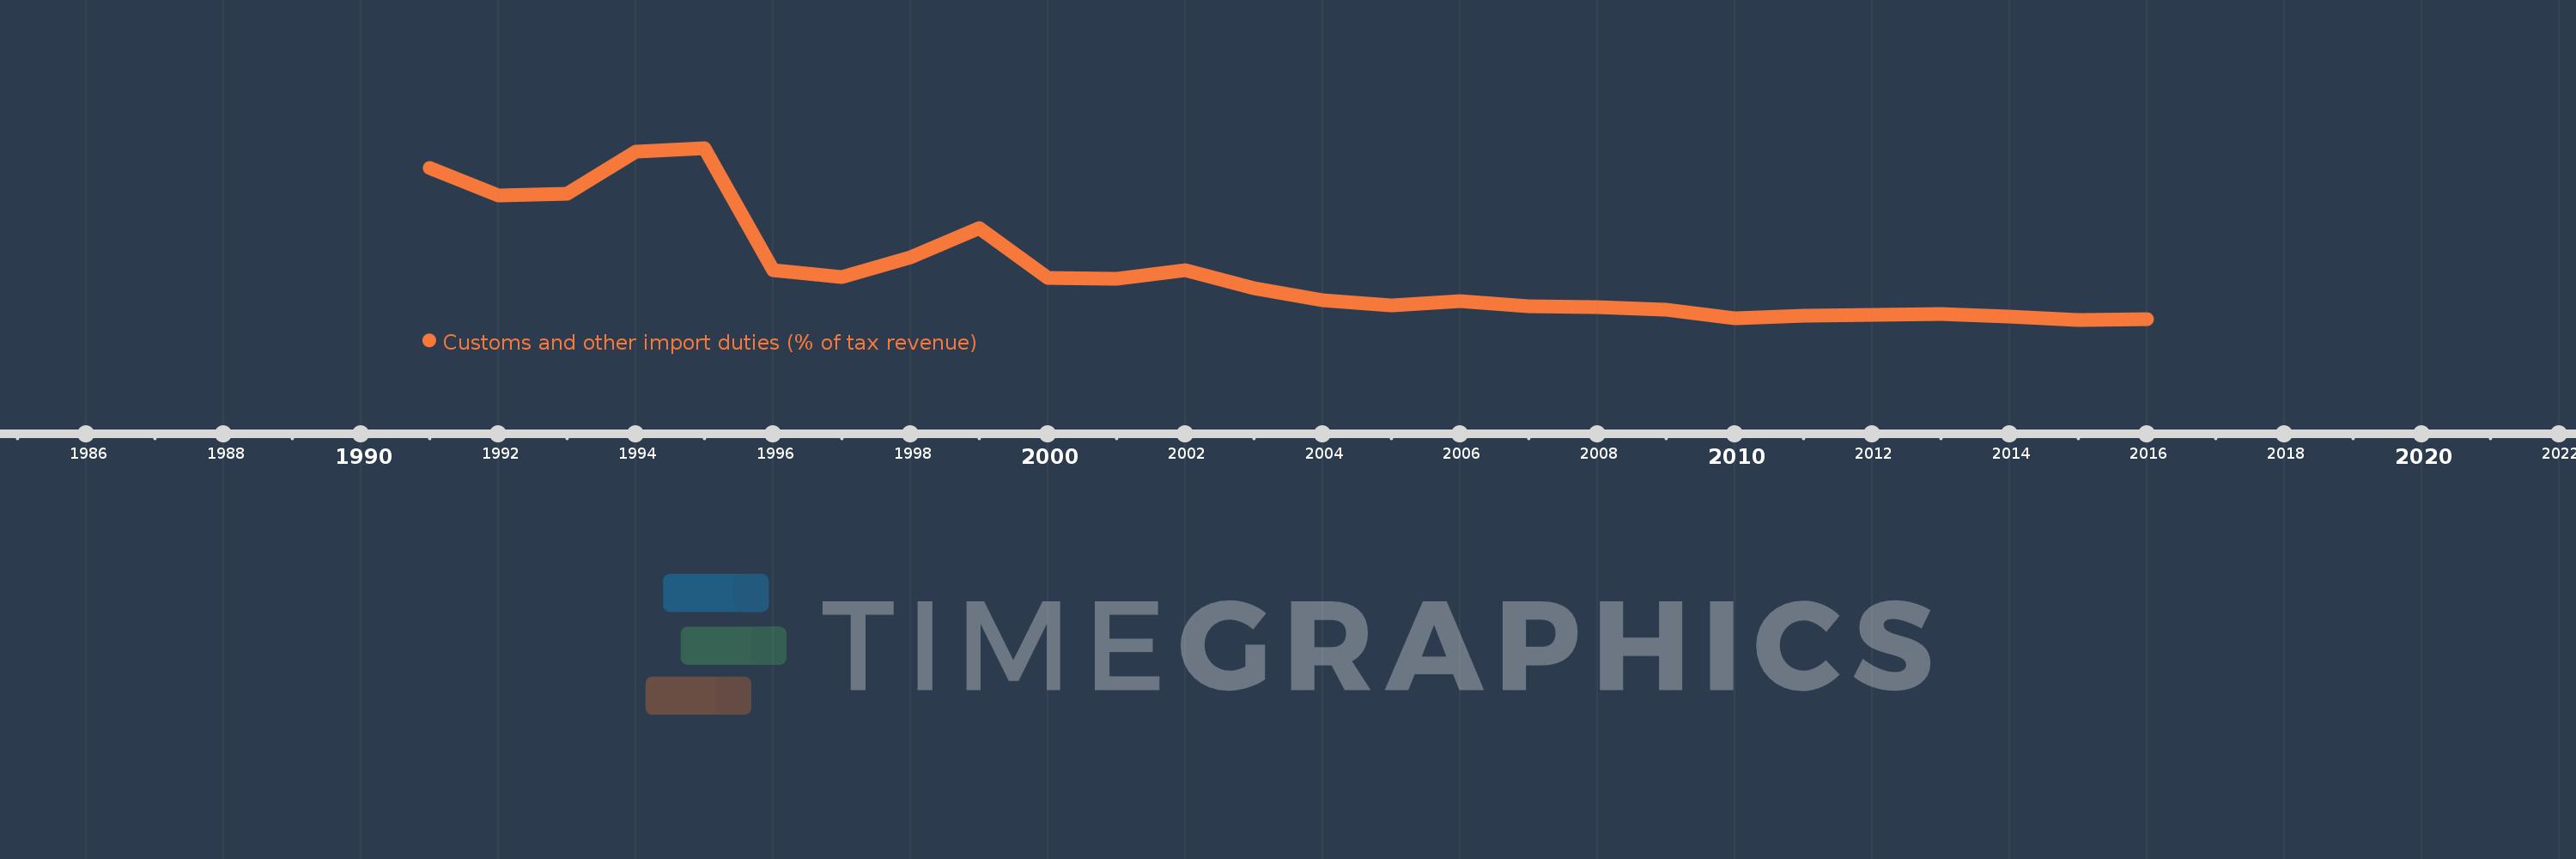
Customs and other import duties (% of tax revenue)
2016,2015,2014,2013,2012,2011,2010,2009,2008,2007,2006,2005,2004,2003,2002,2001,2000,1999,1998,1997,1996,1995,1994,1993,1992,1991
This statistics in other country:
AfghanistanAlbaniaAlgeriaAngolaAntigua and BarbudaArgentinaArmeniaAustraliaAustriaAzerbaijanBahamas, TheBahrainBangladeshBarbadosBelarusBelizeBeninBhutanBoliviaBosnia and HerzegovinaBotswanaBrazilBulgariaBurkina FasoBurundiCabo VerdeCambodiaCentral African RepublicChileChinaColombiaCongo, Dem. Rep.Congo, Rep.Costa RicaCote d'IvoireCroatiaCyprusCzech RepublicDenmarkDominicaDominican RepublicEgypt, Arab Rep.El SalvadorEquatorial GuineaEstoniaEthiopiaFijiFinlandFranceGambia, TheGeorgiaGermanyGhanaGreeceGrenadaGuatemalaHondurasHong Kong SAR, ChinaHungaryIcelandIndiaIndonesiaIran, Islamic Rep.IraqIrelandIsraelItalyJamaicaJapanJordanKazakhstanKenyaKiribatiKorea, Rep.KuwaitKyrgyz RepublicLao PDRLatviaLebanonLiberiaLithuaniaLuxembourgMacedonia, FYRMadagascarMalawiMalaysiaMaldivesMaliMaltaMauritiusMexicoMicronesia, Fed. Sts.MoldovaMongoliaMoroccoMozambiqueMyanmarNamibiaNepalNetherlandsNew ZealandNicaraguaNorwayOmanPakistanPanamaPapua New GuineaParaguayPeruPhilippinesPolandPortugalQatarRomaniaRussian FederationRwandaSamoaSan MarinoSao Tome and PrincipeSenegalSerbiaSeychellesSierra LeoneSingaporeSlovak RepublicSloveniaSolomon IslandsSouth AfricaSpainSri LankaSt. Kitts and NevisSt. LuciaSurinameSwazilandSwedenSwitzerlandSyrian Arab RepublicTajikistanTanzaniaThailandTogoTrinidad and TobagoTunisiaTurkeyUgandaUkraineUnited Arab EmiratesUnited KingdomUnited StatesUruguayVanuatuVenezuela, RBVietnamWest Bank and GazaYemen, Rep.ZambiaZimbabwe Timeline:
This timeline shows a graph from 1991 to 2016 of Nicaragua. No data until 1990. Number of actual observations by date: 26.
Source name:
World Development Indicators
Source organization:
International Monetary Fund, Government Finance Statistics Yearbook and data files.
Categories, topics:
Public Sector, Trade
Last updated:
apr 23, 2017
Indicators value changes by year
Maximum:
26.352
jan 1, 1995
At the date of observation
Value
Absolute change
Change from previous value
jan 1, 1991
23.724
+23.724
0.0%
jan 1, 1992
20.25
-3.474
-14.64%
jan 1, 1993
20.471
+0.221
1.09%
jan 1, 1994
25.895
+5.423
26.49%
jan 1, 1995
26.352
+0.457
1.77%
jan 1, 1996
10.609
-15.743
-59.74%
jan 1, 1997
9.678
-0.93
-8.77%
jan 1, 1998
12.221
+2.542
26.27%
jan 1, 1999
15.956
+3.735
30.56%
jan 1, 2000
9.529
-6.427
-40.28%
jan 1, 2001
9.427
-0.102
-1.07%
jan 1, 2002
10.535
+1.108
11.75%
jan 1, 2003
8.295
-2.24
-21.26%
jan 1, 2004
6.667
-1.628
-19.62%
jan 1, 2005
6.082
-0.585
-8.78%
jan 1, 2006
6.581
+0.499
8.2%
jan 1, 2007
5.977
-0.604
-9.18%
jan 1, 2008
5.759
-0.218
-3.65%
jan 1, 2009
5.445
-0.314
-5.45%
jan 1, 2010
4.375
-1.07
-19.65%
jan 1, 2011
4.654
+0.279
6.38%
jan 1, 2012
4.782
+0.128
2.75%
jan 1, 2013
4.88
+0.098
2.05%
jan 1, 2014
4.623
-0.256
-5.25%
jan 1, 2015
4.185
-0.438
-9.48%
jan 1, 2016
4.274
+0.089
2.12%
Ranking of countries by current statistics by years


Comments: