29
/
en
AIzaSyAYiBZKx7MnpbEhh9jyipgxe19OcubqV5w
April 1, 2024
133955
France
FRA
true
2
1
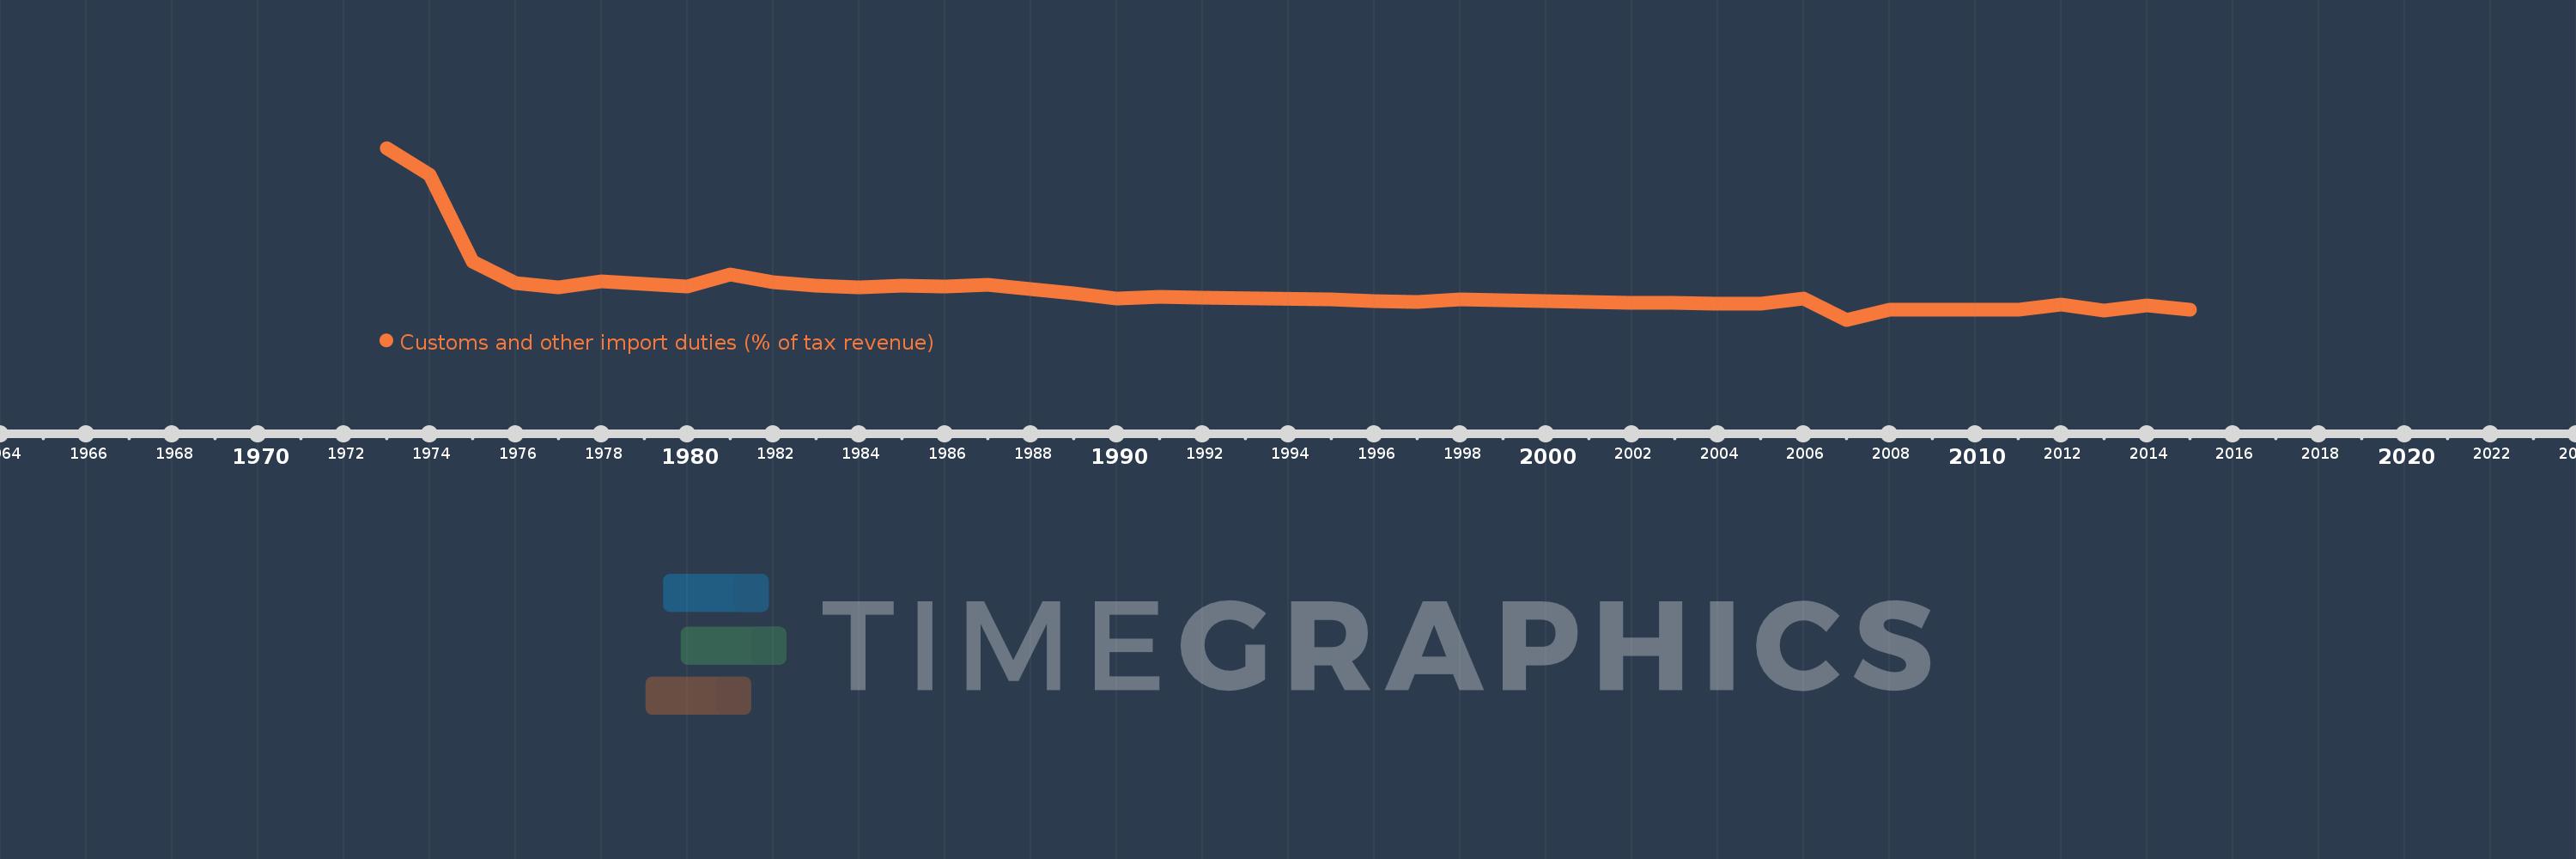
Customs and other import duties (% of tax revenue)
2015,2014,2013,2012,2011,2010,2009,2008,2007,2006,2005,2004,2003,2002,2001,2000,1999,1998,1997,1996,1995,1992,1991,1990,1989,1988,1987,1986,1985,1984,1983,1982,1981,1980,1979,1978,1977,1976,1975,1974,1973
This statistics in other country:
AfghanistanAlbaniaAlgeriaAngolaAntigua and BarbudaArgentinaArmeniaAustraliaAustriaAzerbaijanBahamas, TheBahrainBangladeshBarbadosBelarusBelizeBeninBhutanBoliviaBosnia and HerzegovinaBotswanaBrazilBulgariaBurkina FasoBurundiCabo VerdeCambodiaCentral African RepublicChileChinaColombiaCongo, Dem. Rep.Congo, Rep.Costa RicaCote d'IvoireCroatiaCyprusCzech RepublicDenmarkDominicaDominican RepublicEgypt, Arab Rep.El SalvadorEquatorial GuineaEstoniaEthiopiaFijiFinlandFranceGambia, TheGeorgiaGermanyGhanaGreeceGrenadaGuatemalaHondurasHong Kong SAR, ChinaHungaryIcelandIndiaIndonesiaIran, Islamic Rep.IraqIrelandIsraelItalyJamaicaJapanJordanKazakhstanKenyaKiribatiKorea, Rep.KuwaitKyrgyz RepublicLao PDRLatviaLebanonLiberiaLithuaniaLuxembourgMacedonia, FYRMadagascarMalawiMalaysiaMaldivesMaliMaltaMauritiusMexicoMicronesia, Fed. Sts.MoldovaMongoliaMoroccoMozambiqueMyanmarNamibiaNepalNetherlandsNew ZealandNicaraguaNorwayOmanPakistanPanamaPapua New GuineaParaguayPeruPhilippinesPolandPortugalQatarRomaniaRussian FederationRwandaSamoaSan MarinoSao Tome and PrincipeSenegalSerbiaSeychellesSierra LeoneSingaporeSlovak RepublicSloveniaSolomon IslandsSouth AfricaSpainSri LankaSt. Kitts and NevisSt. LuciaSurinameSwazilandSwedenSwitzerlandSyrian Arab RepublicTajikistanTanzaniaThailandTogoTrinidad and TobagoTunisiaTurkeyUgandaUkraineUnited Arab EmiratesUnited KingdomUnited StatesUruguayVanuatuVenezuela, RBVietnamWest Bank and GazaYemen, Rep.ZambiaZimbabwe Timeline:
This timeline shows a graph from 1973 to 2015 of France. No data until 1972. Number of actual observations by date: 41.
Source name:
World Development Indicators
Source organization:
International Monetary Fund, Government Finance Statistics Yearbook and data files.
Categories, topics:
Public Sector, Trade
Last updated:
apr 23, 2017
Indicators value changes by year
Minimum:
-0.061
jan 1, 2007
At the date of observation
Value
Absolute change
Change from previous value
jan 1, 1973
0.574
+0.574
0.0%
jan 1, 1974
0.476
-0.098
-17.05%
jan 1, 1975
0.154
-0.322
-67.58%
jan 1, 1976
0.073
-0.081
-52.74%
jan 1, 1977
0.059
-0.014
-18.61%
jan 1, 1978
0.082
+0.022
37.66%
jan 1, 1979
0.072
-0.01
-12.07%
jan 1, 1980
0.061
-0.011
-15.13%
jan 1, 1981
0.105
+0.044
72.08%
jan 1, 1982
0.077
-0.028
-26.47%
jan 1, 1983
0.066
-0.011
-14.0%
jan 1, 1984
0.06
-0.006
-9.2%
jan 1, 1985
0.066
+0.006
9.71%
jan 1, 1986
0.061
-0.005
-7.09%
jan 1, 1987
0.067
+0.005
8.47%
jan 1, 1988
0.053
-0.014
-21.04%
jan 1, 1989
0.038
-0.014
-27.3%
jan 1, 1990
0.017
-0.022
-56.66%
jan 1, 1991
0.023
+0.007
39.31%
jan 1, 1992
0.021
-0.002
-9.23%
jan 1, 1995
0.014
-0.007
-35.41%
jan 1, 1996
0.009
-0.005
-34.41%
jan 1, 1997
0.004
-0.005
-55.76%
jan 1, 1998
0.014
+0.01
264.96%
jan 1, 1999
0.012
-0.002
-14.71%
jan 1, 2000
0.007
-0.005
-40.6%
jan 1, 2001
0.006
-0.002
-24.26%
jan 1, 2002
0.002
-0.004
-64.58%
jan 1, 2003
0.001
-0.001
-28.33%
jan 1, 2004
-0.001
-0.003
-199.37%
jan 1, 2005
-0.003
-0.002
110.0%
jan 1, 2006
0.019
+0.021
-736.14%
jan 1, 2007
-0.061
-0.079
-428.39%
jan 1, 2008
-0.023
+0.038
-62.57%
jan 1, 2009
-0.025
-0.002
8.93%
jan 1, 2010
-0.024
+0.001
-2.58%
jan 1, 2011
-0.025
0.0
1.93%
jan 1, 2012
-0.004
+0.021
-84.66%
jan 1, 2013
-0.027
-0.023
607.04%
jan 1, 2014
-0.008
+0.019
-71.13%
jan 1, 2015
-0.023
-0.016
202.09%
Ranking of countries by current statistics by years


Comments: