29
/
en
AIzaSyAYiBZKx7MnpbEhh9jyipgxe19OcubqV5w
April 1, 2024
195364
Mexico
MEX
true
2
1
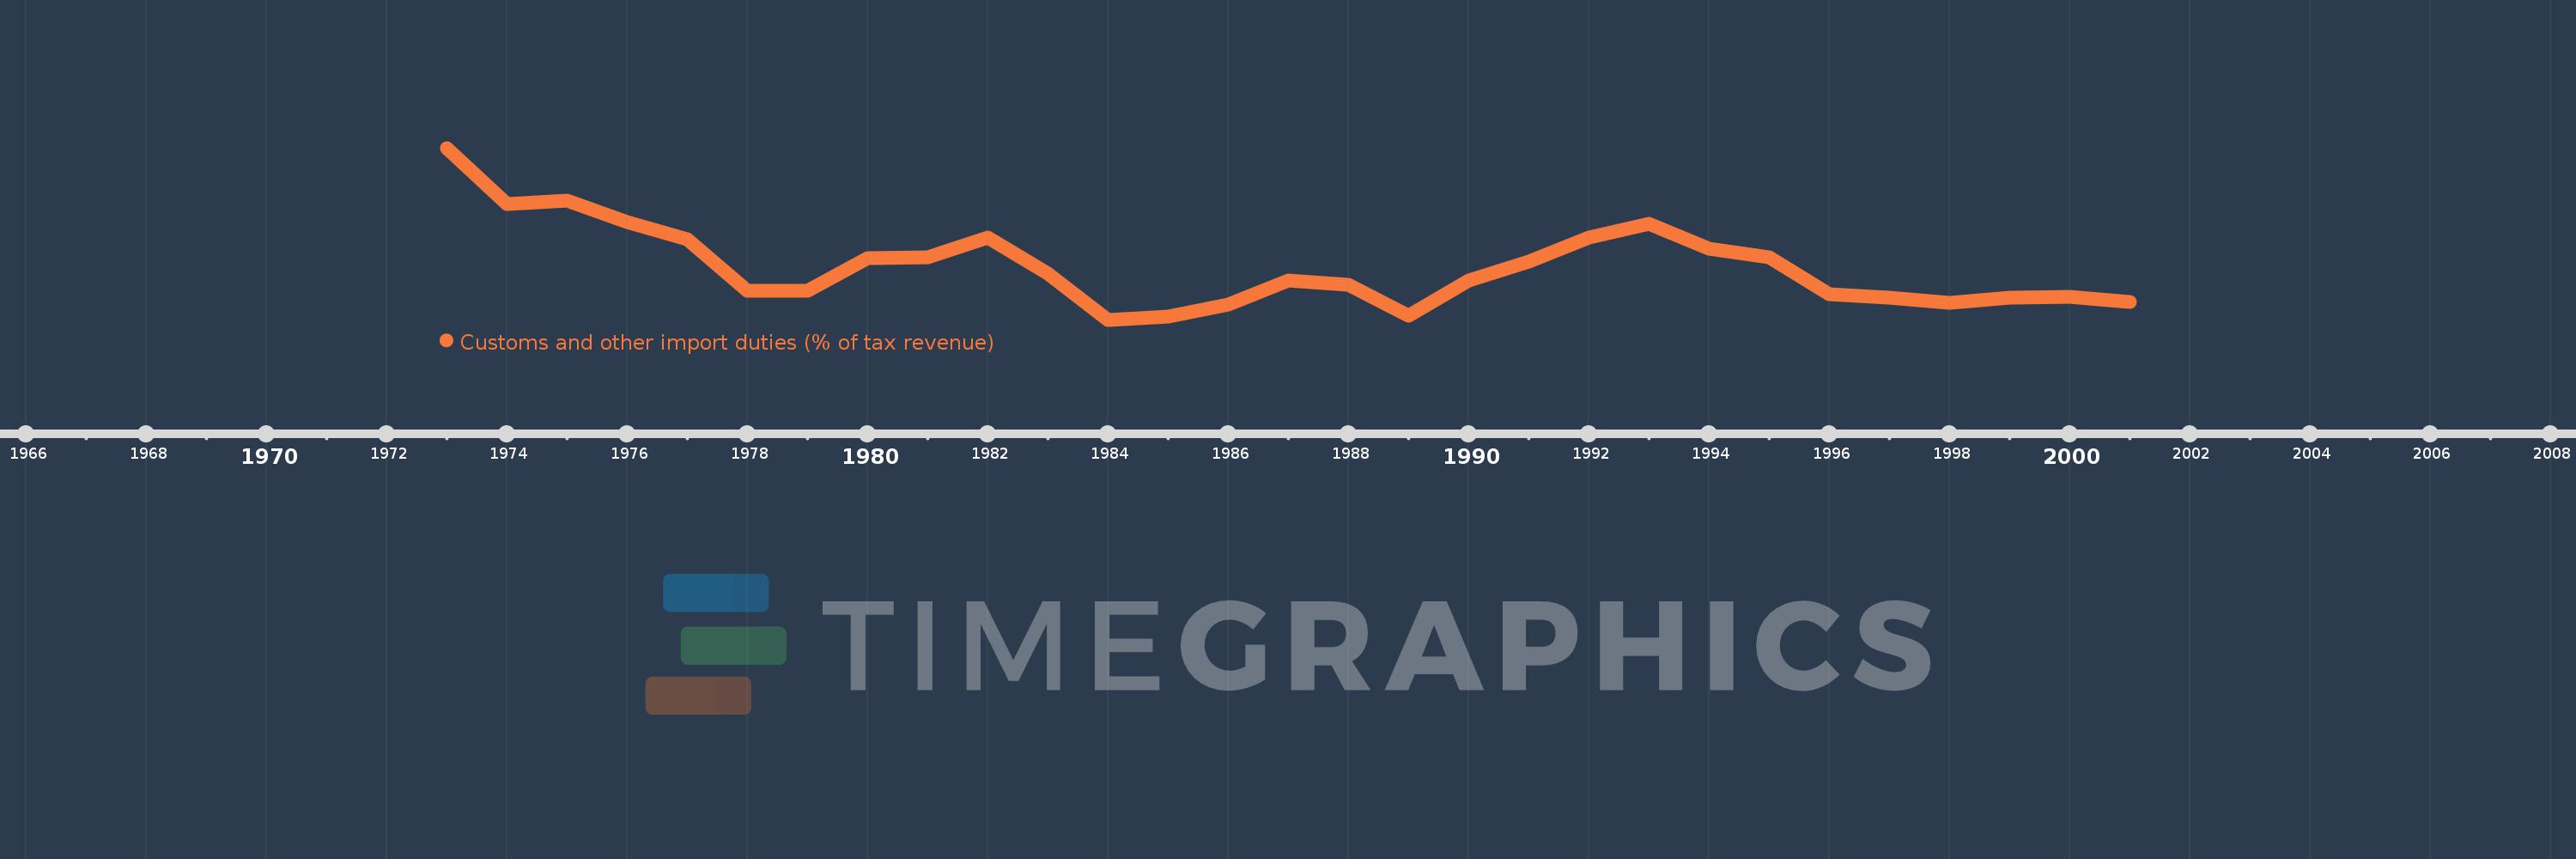
Customs and other import duties (% of tax revenue)
2001,2000,1999,1998,1997,1996,1995,1994,1993,1992,1991,1990,1989,1988,1987,1986,1985,1984,1983,1982,1981,1980,1979,1978,1977,1976,1975,1974,1973
This statistics in other country:
AfghanistanAlbaniaAlgeriaAngolaAntigua and BarbudaArgentinaArmeniaAustraliaAustriaAzerbaijanBahamas, TheBahrainBangladeshBarbadosBelarusBelizeBeninBhutanBoliviaBosnia and HerzegovinaBotswanaBrazilBulgariaBurkina FasoBurundiCabo VerdeCambodiaCentral African RepublicChileChinaColombiaCongo, Dem. Rep.Congo, Rep.Costa RicaCote d'IvoireCroatiaCyprusCzech RepublicDenmarkDominicaDominican RepublicEgypt, Arab Rep.El SalvadorEquatorial GuineaEstoniaEthiopiaFijiFinlandFranceGambia, TheGeorgiaGermanyGhanaGreeceGrenadaGuatemalaHondurasHong Kong SAR, ChinaHungaryIcelandIndiaIndonesiaIran, Islamic Rep.IraqIrelandIsraelItalyJamaicaJapanJordanKazakhstanKenyaKiribatiKorea, Rep.KuwaitKyrgyz RepublicLao PDRLatviaLebanonLiberiaLithuaniaLuxembourgMacedonia, FYRMadagascarMalawiMalaysiaMaldivesMaliMaltaMauritiusMexicoMicronesia, Fed. Sts.MoldovaMongoliaMoroccoMozambiqueMyanmarNamibiaNepalNetherlandsNew ZealandNicaraguaNorwayOmanPakistanPanamaPapua New GuineaParaguayPeruPhilippinesPolandPortugalQatarRomaniaRussian FederationRwandaSamoaSan MarinoSao Tome and PrincipeSenegalSerbiaSeychellesSierra LeoneSingaporeSlovak RepublicSloveniaSolomon IslandsSouth AfricaSpainSri LankaSt. Kitts and NevisSt. LuciaSurinameSwazilandSwedenSwitzerlandSyrian Arab RepublicTajikistanTanzaniaThailandTogoTrinidad and TobagoTunisiaTurkeyUgandaUkraineUnited Arab EmiratesUnited KingdomUnited StatesUruguayVanuatuVenezuela, RBVietnamWest Bank and GazaYemen, Rep.ZambiaZimbabwe Timeline:
This timeline shows a graph from 1973 to 2001 of Mexico. No data until 1972. Number of actual observations by date: 29.
Source name:
World Development Indicators
Source organization:
International Monetary Fund, Government Finance Statistics Yearbook and data files.
Categories, topics:
Public Sector, Trade
Last updated:
apr 23, 2017
Indicators value changes by year
Maximum:
16.279
jan 1, 1973
At the date of observation
Value
Absolute change
Change from previous value
jan 1, 1973
16.279
+16.279
0.0%
jan 1, 1974
12.245
-4.034
-24.78%
jan 1, 1975
12.5
+0.255
2.08%
jan 1, 1976
10.891
-1.609
-12.87%
jan 1, 1977
9.677
-1.214
-11.14%
jan 1, 1978
5.978
-3.699
-38.22%
jan 1, 1979
5.976
-0.002
-0.04%
jan 1, 1980
8.333
+2.357
39.44%
jan 1, 1981
8.349
+0.015
0.19%
jan 1, 1982
9.824
+1.475
17.67%
jan 1, 1983
7.192
-2.632
-26.79%
jan 1, 1984
3.856
-3.336
-46.39%
jan 1, 1985
4.074
+0.218
5.66%
jan 1, 1986
4.955
+0.882
21.64%
jan 1, 1987
6.716
+1.761
35.54%
jan 1, 1988
6.381
-0.336
-5.0%
jan 1, 1989
4.15
-2.231
-34.97%
jan 1, 1990
6.665
+2.515
60.6%
jan 1, 1991
8.038
+1.373
20.61%
jan 1, 1992
9.828
+1.791
22.28%
jan 1, 1993
10.764
+0.936
9.52%
jan 1, 1994
8.963
-1.801
-16.73%
jan 1, 1995
8.4
-0.563
-6.28%
jan 1, 1996
5.686
-2.714
-32.31%
jan 1, 1997
5.44
-0.246
-4.32%
jan 1, 1998
5.083
-0.357
-6.56%
jan 1, 1999
5.478
+0.394
7.76%
jan 1, 2000
5.527
+0.05
0.91%
jan 1, 2001
5.128
-0.399
-7.22%
Ranking of countries by current statistics by years


Comments: