29
/
en
AIzaSyAYiBZKx7MnpbEhh9jyipgxe19OcubqV5w
April 1, 2024
242434
Slovenia
SVN
true
2
1
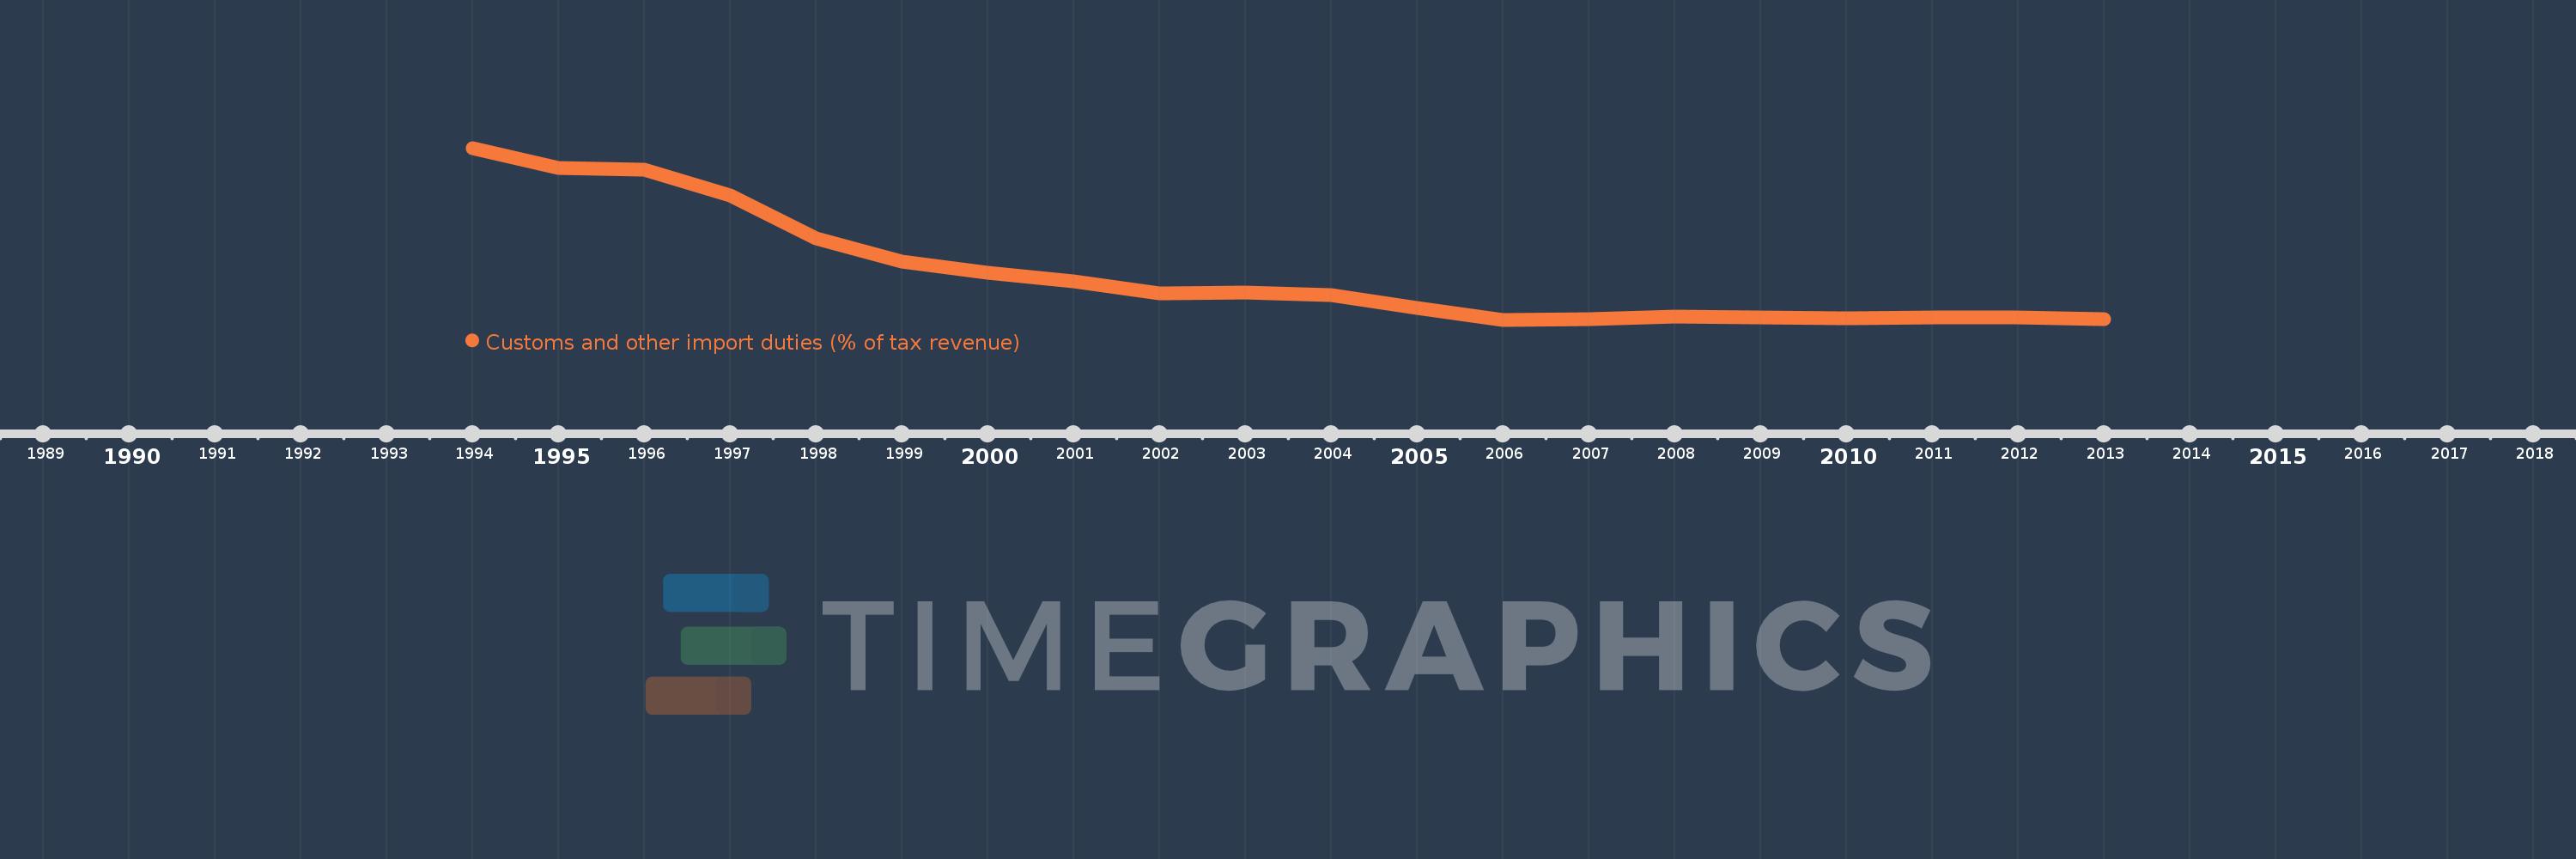
Customs and other import duties (% of tax revenue)
2013,2012,2011,2010,2009,2008,2007,2006,2005,2004,2003,2002,2001,2000,1999,1998,1997,1996,1995,1994
This statistics in other country:
AfghanistanAlbaniaAlgeriaAngolaAntigua and BarbudaArgentinaArmeniaAustraliaAustriaAzerbaijanBahamas, TheBahrainBangladeshBarbadosBelarusBelizeBeninBhutanBoliviaBosnia and HerzegovinaBotswanaBrazilBulgariaBurkina FasoBurundiCabo VerdeCambodiaCentral African RepublicChileChinaColombiaCongo, Dem. Rep.Congo, Rep.Costa RicaCote d'IvoireCroatiaCyprusCzech RepublicDenmarkDominicaDominican RepublicEgypt, Arab Rep.El SalvadorEquatorial GuineaEstoniaEthiopiaFijiFinlandFranceGambia, TheGeorgiaGermanyGhanaGreeceGrenadaGuatemalaHondurasHong Kong SAR, ChinaHungaryIcelandIndiaIndonesiaIran, Islamic Rep.IraqIrelandIsraelItalyJamaicaJapanJordanKazakhstanKenyaKiribatiKorea, Rep.KuwaitKyrgyz RepublicLao PDRLatviaLebanonLiberiaLithuaniaLuxembourgMacedonia, FYRMadagascarMalawiMalaysiaMaldivesMaliMaltaMauritiusMexicoMicronesia, Fed. Sts.MoldovaMongoliaMoroccoMozambiqueMyanmarNamibiaNepalNetherlandsNew ZealandNicaraguaNorwayOmanPakistanPanamaPapua New GuineaParaguayPeruPhilippinesPolandPortugalQatarRomaniaRussian FederationRwandaSamoaSan MarinoSao Tome and PrincipeSenegalSerbiaSeychellesSierra LeoneSingaporeSlovak RepublicSloveniaSolomon IslandsSouth AfricaSpainSri LankaSt. Kitts and NevisSt. LuciaSurinameSwazilandSwedenSwitzerlandSyrian Arab RepublicTajikistanTanzaniaThailandTogoTrinidad and TobagoTunisiaTurkeyUgandaUkraineUnited Arab EmiratesUnited KingdomUnited StatesUruguayVanuatuVenezuela, RBVietnamWest Bank and GazaYemen, Rep.ZambiaZimbabwe Timeline:
This timeline shows a graph from 1994 to 2013 of Slovenia. No data until 1993. Number of actual observations by date: 20.
Source name:
World Development Indicators
Source organization:
International Monetary Fund, Government Finance Statistics Yearbook and data files.
Categories, topics:
Public Sector, Trade
Last updated:
apr 23, 2017
Indicators value changes by year
Maximum:
18.204
jan 1, 1994
At the date of observation
Value
Absolute change
Change from previous value
jan 1, 1994
18.204
+18.204
0.0%
jan 1, 1995
16.144
-2.061
-11.32%
jan 1, 1996
15.93
-0.214
-1.32%
jan 1, 1997
13.205
-2.725
-17.11%
jan 1, 1998
8.726
-4.478
-33.92%
jan 1, 1999
6.243
-2.483
-28.45%
jan 1, 2000
5.139
-1.104
-17.68%
jan 1, 2001
4.184
-0.956
-18.59%
jan 1, 2002
2.914
-1.27
-30.35%
jan 1, 2003
2.998
+0.084
2.87%
jan 1, 2004
2.767
-0.23
-7.67%
jan 1, 2005
1.45
-1.317
-47.61%
jan 1, 2006
0.181
-1.269
-87.53%
jan 1, 2007
0.233
+0.052
28.73%
jan 1, 2008
0.509
+0.276
118.59%
jan 1, 2009
0.404
-0.104
-20.53%
jan 1, 2010
0.334
-0.07
-17.43%
jan 1, 2011
0.399
+0.065
19.41%
jan 1, 2012
0.403
+0.005
1.19%
jan 1, 2013
0.276
-0.127
-31.6%
Ranking of countries by current statistics by years


Comments: