29
/
en
AIzaSyAYiBZKx7MnpbEhh9jyipgxe19OcubqV5w
April 1, 2024
176223
Lebanon
LBN
true
2
1
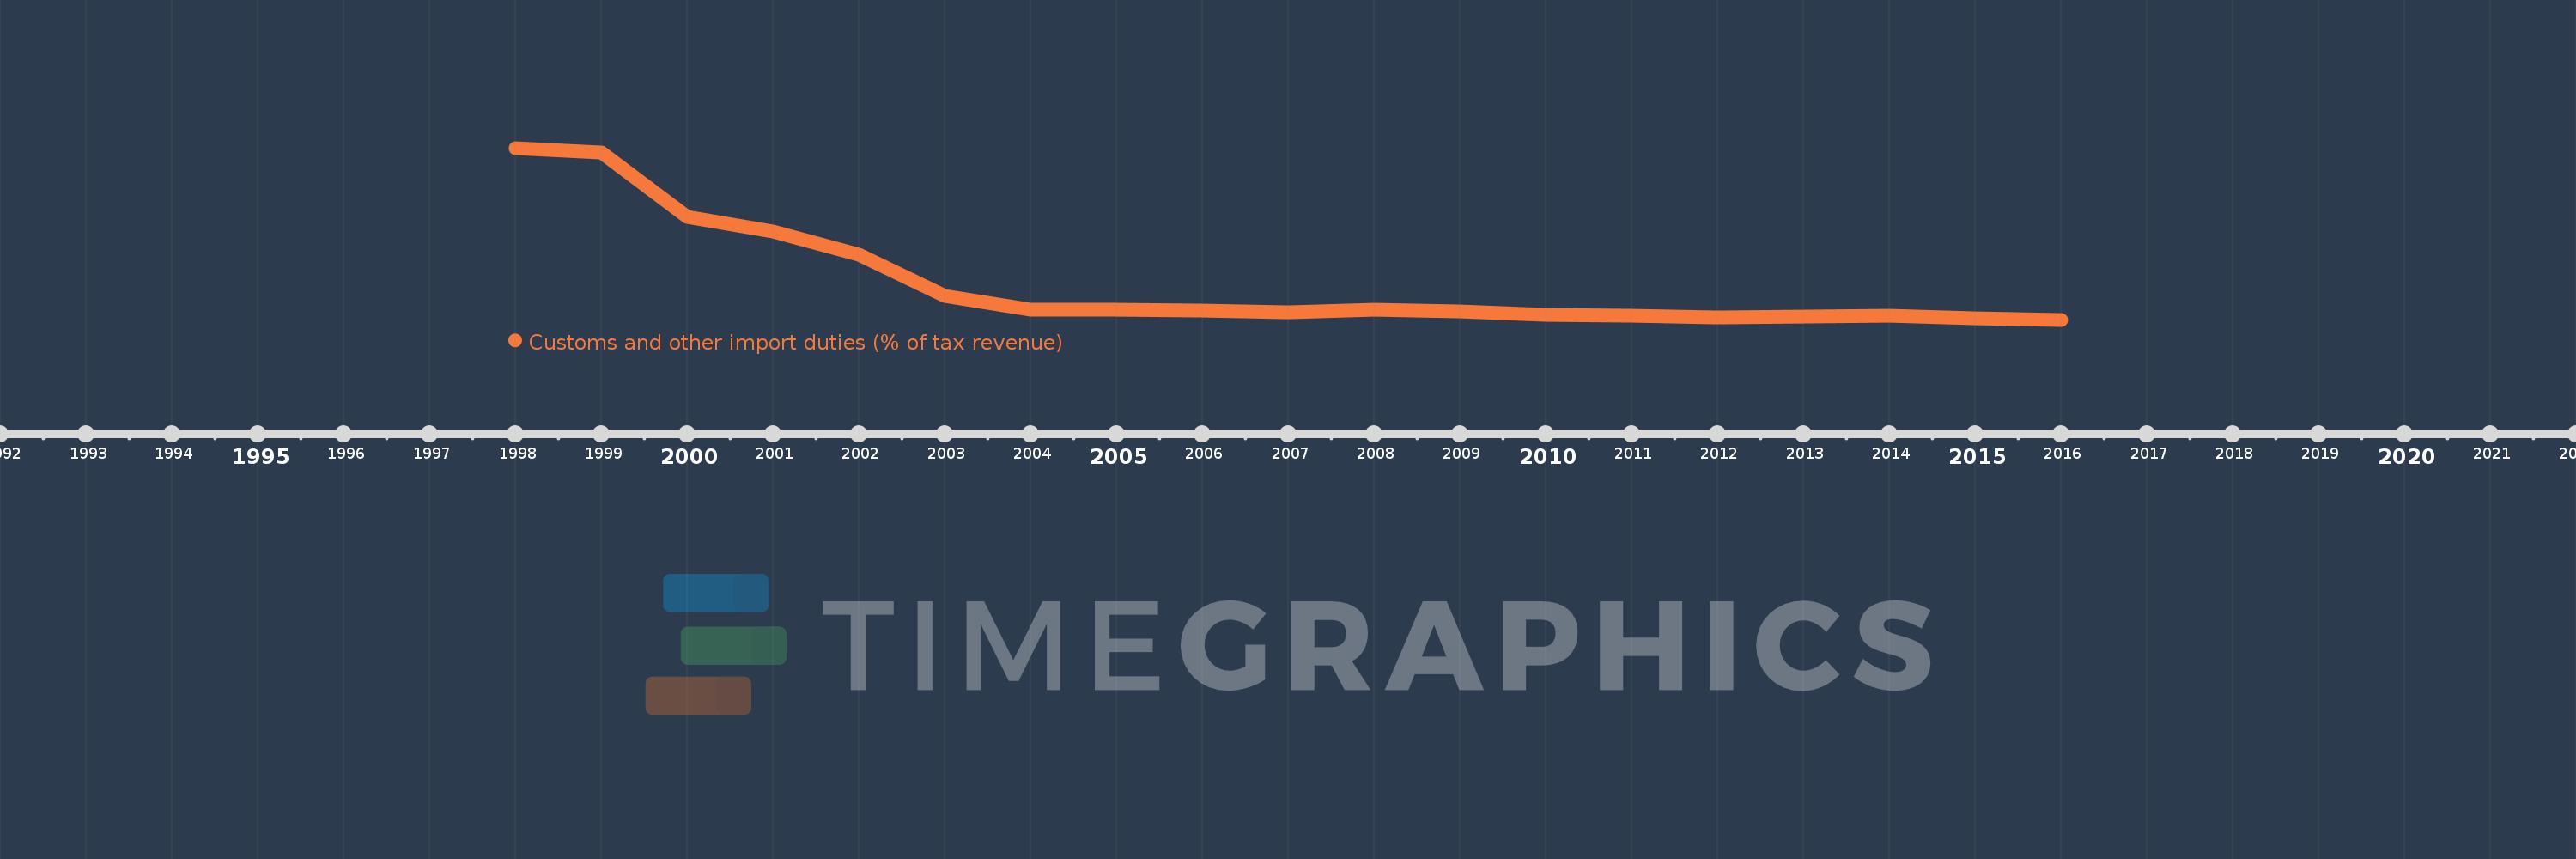
Customs and other import duties (% of tax revenue)
2016,2015,2014,2013,2012,2011,2010,2009,2008,2007,2006,2005,2004,2003,2002,2001,2000,1999,1998
This statistics in other country:
AfghanistanAlbaniaAlgeriaAngolaAntigua and BarbudaArgentinaArmeniaAustraliaAustriaAzerbaijanBahamas, TheBahrainBangladeshBarbadosBelarusBelizeBeninBhutanBoliviaBosnia and HerzegovinaBotswanaBrazilBulgariaBurkina FasoBurundiCabo VerdeCambodiaCentral African RepublicChileChinaColombiaCongo, Dem. Rep.Congo, Rep.Costa RicaCote d'IvoireCroatiaCyprusCzech RepublicDenmarkDominicaDominican RepublicEgypt, Arab Rep.El SalvadorEquatorial GuineaEstoniaEthiopiaFijiFinlandFranceGambia, TheGeorgiaGermanyGhanaGreeceGrenadaGuatemalaHondurasHong Kong SAR, ChinaHungaryIcelandIndiaIndonesiaIran, Islamic Rep.IraqIrelandIsraelItalyJamaicaJapanJordanKazakhstanKenyaKiribatiKorea, Rep.KuwaitKyrgyz RepublicLao PDRLatviaLebanonLiberiaLithuaniaLuxembourgMacedonia, FYRMadagascarMalawiMalaysiaMaldivesMaliMaltaMauritiusMexicoMicronesia, Fed. Sts.MoldovaMongoliaMoroccoMozambiqueMyanmarNamibiaNepalNetherlandsNew ZealandNicaraguaNorwayOmanPakistanPanamaPapua New GuineaParaguayPeruPhilippinesPolandPortugalQatarRomaniaRussian FederationRwandaSamoaSan MarinoSao Tome and PrincipeSenegalSerbiaSeychellesSierra LeoneSingaporeSlovak RepublicSloveniaSolomon IslandsSouth AfricaSpainSri LankaSt. Kitts and NevisSt. LuciaSurinameSwazilandSwedenSwitzerlandSyrian Arab RepublicTajikistanTanzaniaThailandTogoTrinidad and TobagoTunisiaTurkeyUgandaUkraineUnited Arab EmiratesUnited KingdomUnited StatesUruguayVanuatuVenezuela, RBVietnamWest Bank and GazaYemen, Rep.ZambiaZimbabwe Timeline:
This timeline shows a graph from 1998 to 2016 of Lebanon. No data until 1997. Number of actual observations by date: 19.
Source name:
World Development Indicators
Source organization:
International Monetary Fund, Government Finance Statistics Yearbook and data files.
Categories, topics:
Public Sector, Trade
Last updated:
apr 23, 2017
Indicators value changes by year
Maximum:
60.178
jan 1, 1998
At the date of observation
Value
Absolute change
Change from previous value
jan 1, 1998
60.178
+60.178
0.0%
jan 1, 1999
58.859
-1.319
-2.19%
jan 1, 2000
38.966
-19.893
-33.8%
jan 1, 2001
34.427
-4.539
-11.65%
jan 1, 2002
27.101
-7.326
-21.28%
jan 1, 2003
14.295
-12.806
-47.25%
jan 1, 2004
10.212
-4.083
-28.56%
jan 1, 2005
10.057
-0.155
-1.52%
jan 1, 2006
9.785
-0.272
-2.71%
jan 1, 2007
9.255
-0.53
-5.41%
jan 1, 2008
10.022
+0.767
8.29%
jan 1, 2009
9.514
-0.508
-5.07%
jan 1, 2010
8.54
-0.973
-10.23%
jan 1, 2011
8.295
-0.245
-2.87%
jan 1, 2012
7.879
-0.416
-5.02%
jan 1, 2013
7.896
+0.017
0.22%
jan 1, 2014
8.214
+0.318
4.03%
jan 1, 2015
7.487
-0.727
-8.86%
jan 1, 2016
7.038
-0.448
-5.98%
Ranking of countries by current statistics by years


Comments: