29
/
en
AIzaSyAYiBZKx7MnpbEhh9jyipgxe19OcubqV5w
April 1, 2024
109508
Congo, Dem. Rep.
COD
true
2
1
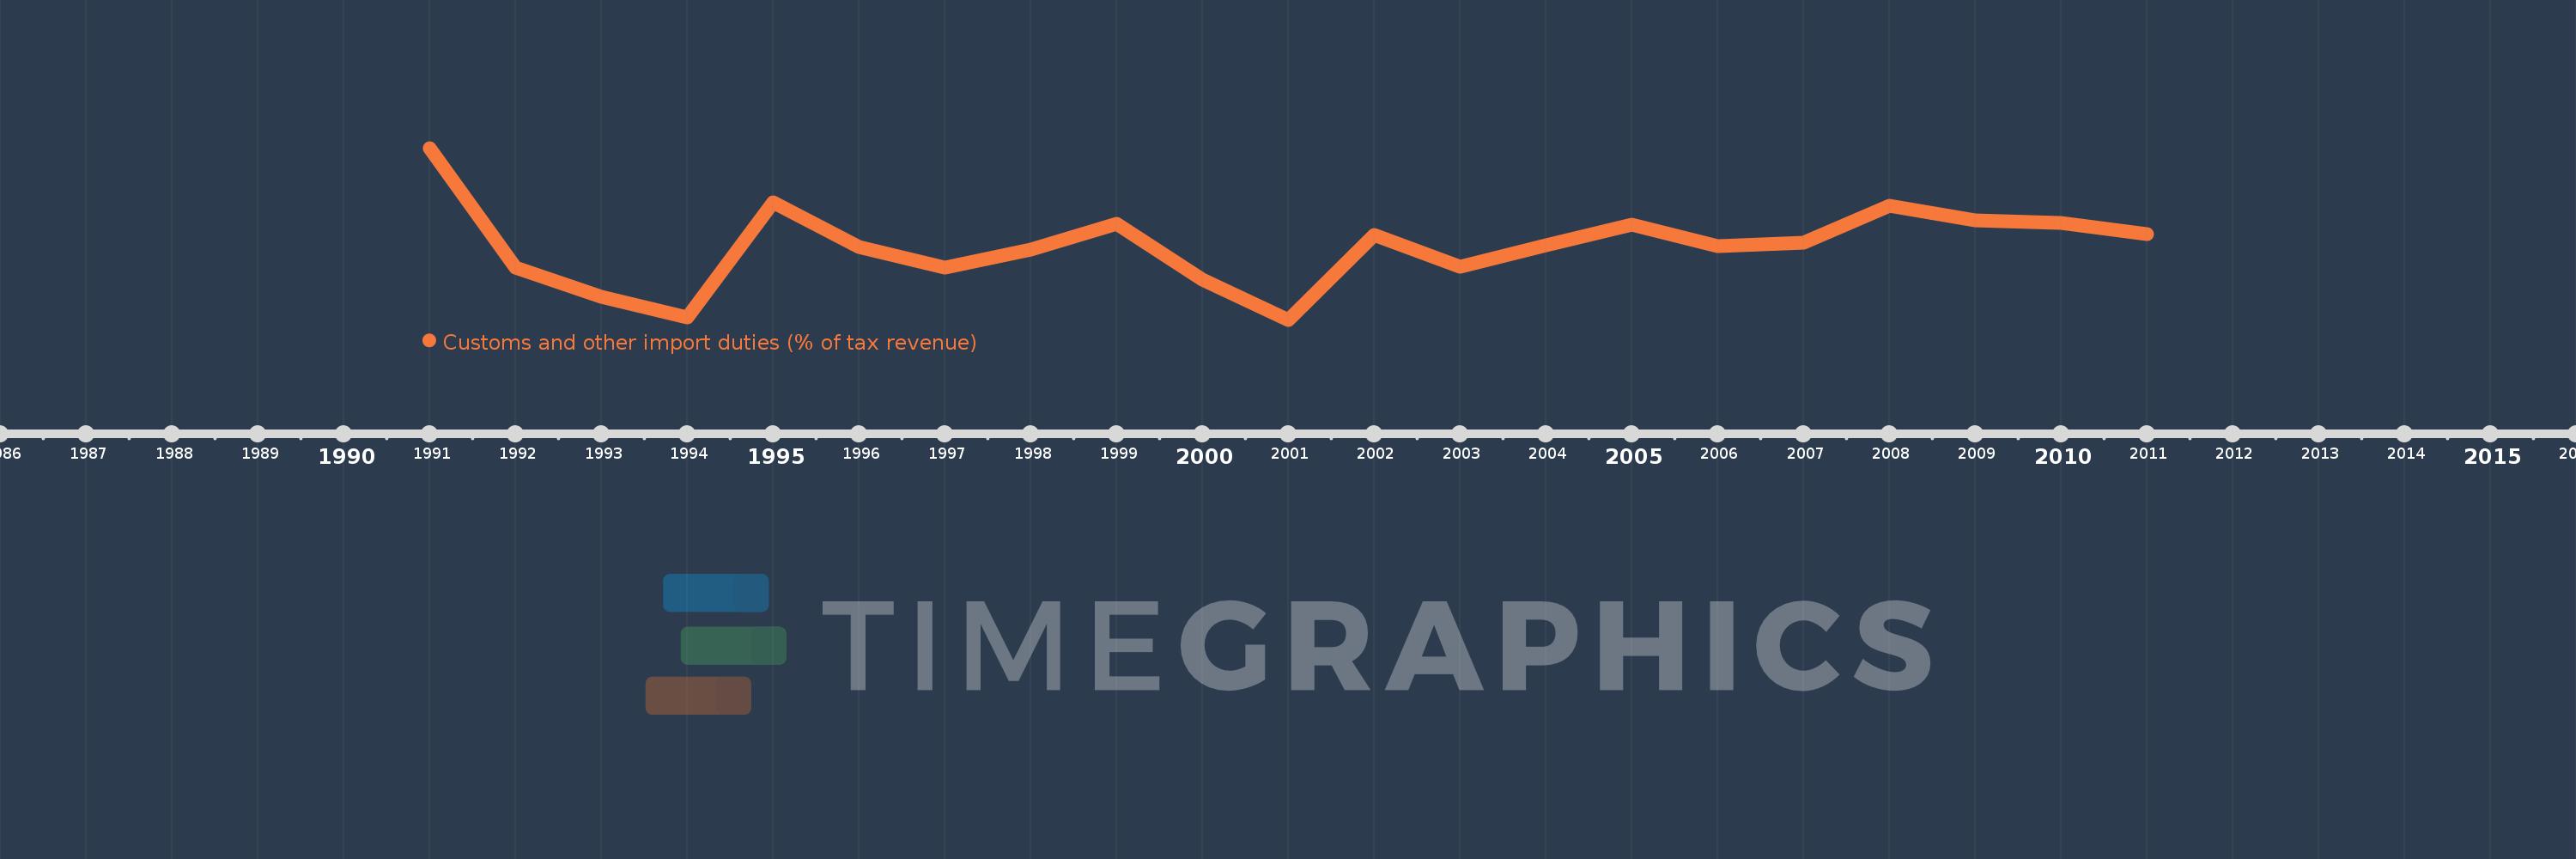
Customs and other import duties (% of tax revenue)
2011,2010,2009,2008,2007,2006,2005,2004,2003,2002,2001,2000,1999,1998,1997,1996,1995,1994,1993,1992,1991
This statistics in other country:
AfghanistanAlbaniaAlgeriaAngolaAntigua and BarbudaArgentinaArmeniaAustraliaAustriaAzerbaijanBahamas, TheBahrainBangladeshBarbadosBelarusBelizeBeninBhutanBoliviaBosnia and HerzegovinaBotswanaBrazilBulgariaBurkina FasoBurundiCabo VerdeCambodiaCentral African RepublicChileChinaColombiaCongo, Dem. Rep.Congo, Rep.Costa RicaCote d'IvoireCroatiaCyprusCzech RepublicDenmarkDominicaDominican RepublicEgypt, Arab Rep.El SalvadorEquatorial GuineaEstoniaEthiopiaFijiFinlandFranceGambia, TheGeorgiaGermanyGhanaGreeceGrenadaGuatemalaHondurasHong Kong SAR, ChinaHungaryIcelandIndiaIndonesiaIran, Islamic Rep.IraqIrelandIsraelItalyJamaicaJapanJordanKazakhstanKenyaKiribatiKorea, Rep.KuwaitKyrgyz RepublicLao PDRLatviaLebanonLiberiaLithuaniaLuxembourgMacedonia, FYRMadagascarMalawiMalaysiaMaldivesMaliMaltaMauritiusMexicoMicronesia, Fed. Sts.MoldovaMongoliaMoroccoMozambiqueMyanmarNamibiaNepalNetherlandsNew ZealandNicaraguaNorwayOmanPakistanPanamaPapua New GuineaParaguayPeruPhilippinesPolandPortugalQatarRomaniaRussian FederationRwandaSamoaSan MarinoSao Tome and PrincipeSenegalSerbiaSeychellesSierra LeoneSingaporeSlovak RepublicSloveniaSolomon IslandsSouth AfricaSpainSri LankaSt. Kitts and NevisSt. LuciaSurinameSwazilandSwedenSwitzerlandSyrian Arab RepublicTajikistanTanzaniaThailandTogoTrinidad and TobagoTunisiaTurkeyUgandaUkraineUnited Arab EmiratesUnited KingdomUnited StatesUruguayVanuatuVenezuela, RBVietnamWest Bank and GazaYemen, Rep.ZambiaZimbabwe Timeline:
This timeline shows a graph from 1991 to 2011 of Congo, Dem. Rep.. No data until 1990. Number of actual observations by date: 21.
Source name:
World Development Indicators
Source organization:
International Monetary Fund, Government Finance Statistics Yearbook and data files.
Categories, topics:
Public Sector, Trade
Last updated:
apr 23, 2017
Indicators value changes by year
At the date of observation
Value
Absolute change
Change from previous value
jan 1, 1991
45.63
+45.63
0.0%
jan 1, 1992
30.196
-15.434
-33.82%
jan 1, 1993
26.378
-3.818
-12.64%
jan 1, 1994
23.735
-2.643
-10.02%
jan 1, 1995
38.583
+14.847
62.55%
jan 1, 1996
32.839
-5.744
-14.89%
jan 1, 1997
30.195
-2.644
-8.05%
jan 1, 1998
32.482
+2.287
7.57%
jan 1, 1999
35.864
+3.381
10.41%
jan 1, 2000
28.611
-7.252
-20.22%
jan 1, 2001
23.43
-5.181
-18.11%
jan 1, 2002
34.372
+10.942
46.7%
jan 1, 2003
30.32
-4.052
-11.79%
jan 1, 2004
33.071
+2.751
9.07%
jan 1, 2005
35.687
+2.616
7.91%
jan 1, 2006
32.889
-2.799
-7.84%
jan 1, 2007
33.336
+0.447
1.36%
jan 1, 2008
38.131
+4.795
14.38%
jan 1, 2009
36.293
-1.838
-4.82%
jan 1, 2010
35.924
-0.369
-1.02%
jan 1, 2011
34.474
-1.45
-4.04%
Ranking of countries by current statistics by years


Comments: