29
/
en
AIzaSyAYiBZKx7MnpbEhh9jyipgxe19OcubqV5w
April 1, 2024
69634
Argentina
ARG
true
2
1
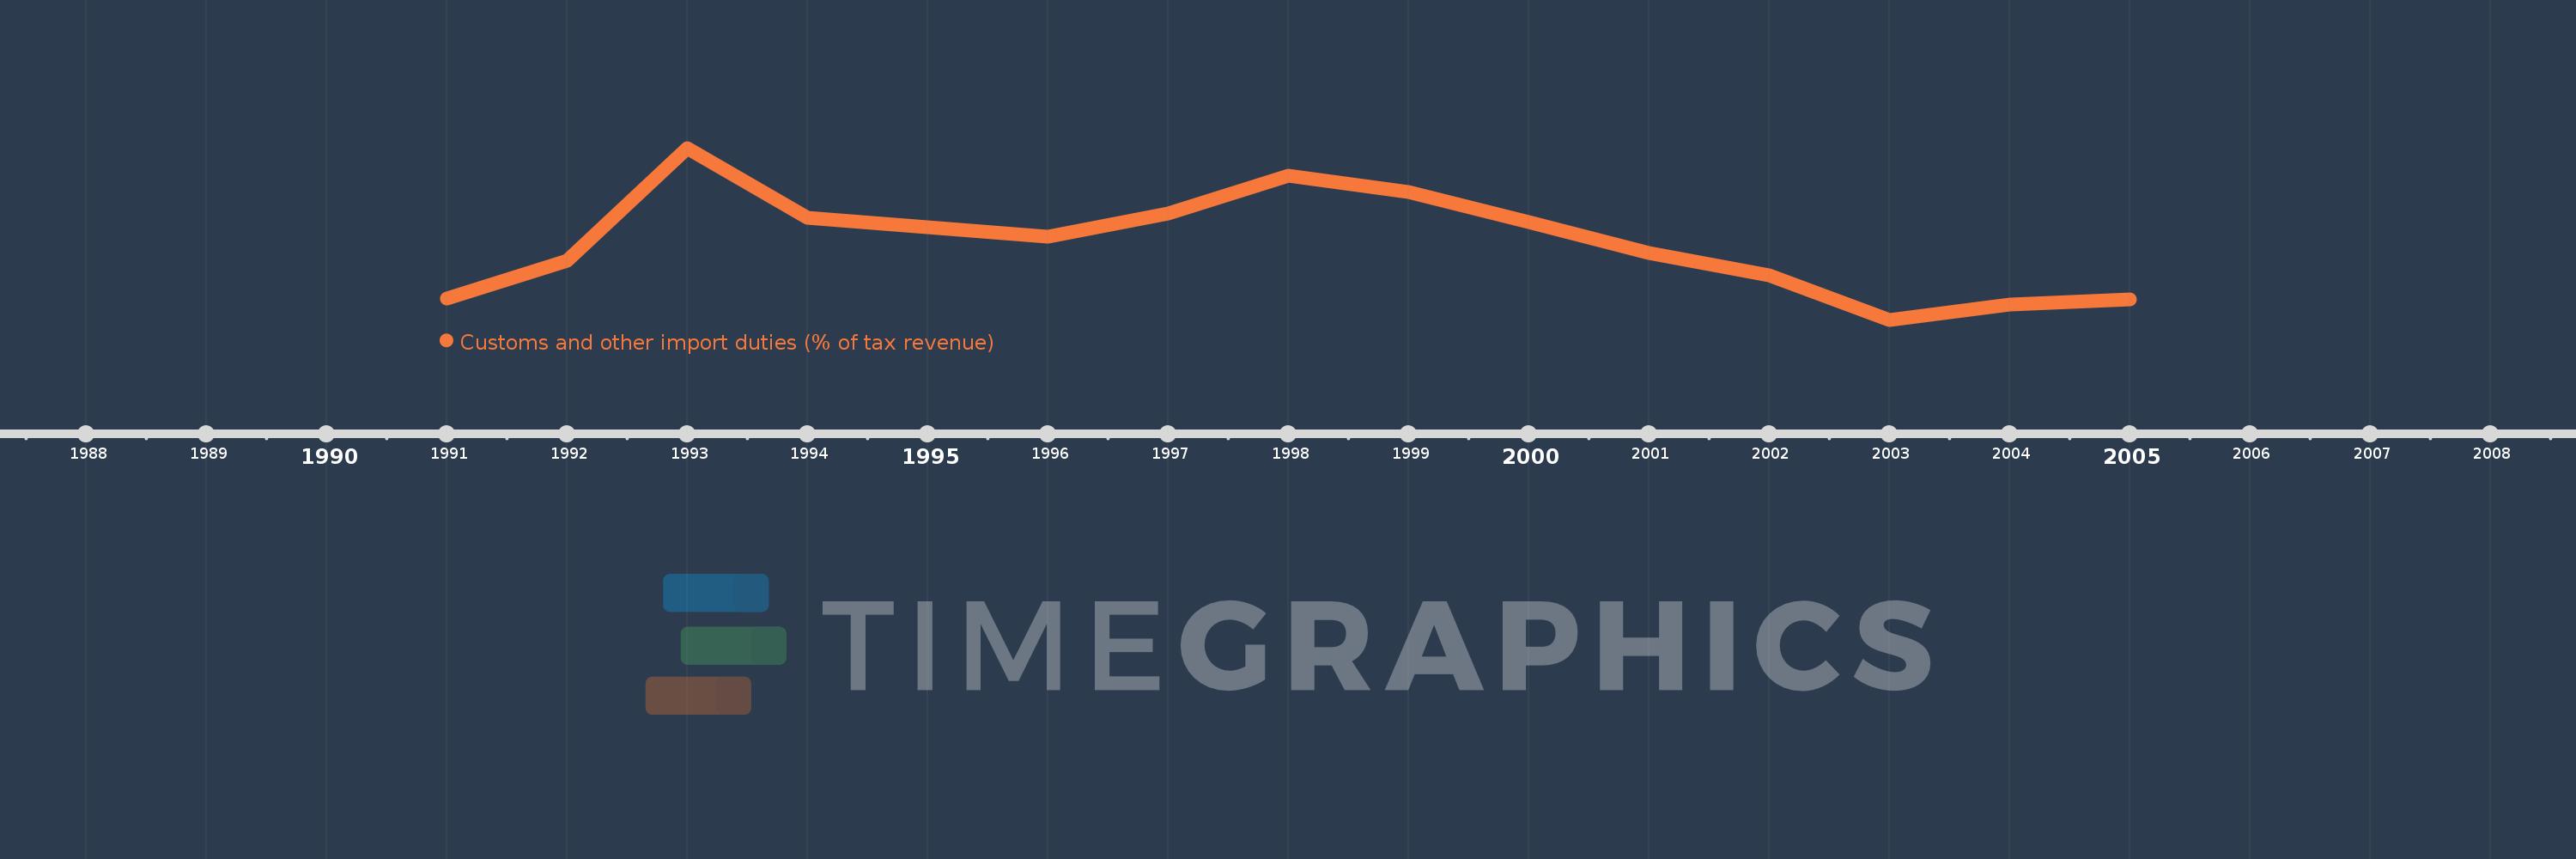
Customs and other import duties (% of tax revenue)
2005,2004,2003,2002,2001,2000,1999,1998,1997,1996,1995,1994,1993,1992,1991
This statistics in other country:
AfghanistanAlbaniaAlgeriaAngolaAntigua and BarbudaArgentinaArmeniaAustraliaAustriaAzerbaijanBahamas, TheBahrainBangladeshBarbadosBelarusBelizeBeninBhutanBoliviaBosnia and HerzegovinaBotswanaBrazilBulgariaBurkina FasoBurundiCabo VerdeCambodiaCentral African RepublicChileChinaColombiaCongo, Dem. Rep.Congo, Rep.Costa RicaCote d'IvoireCroatiaCyprusCzech RepublicDenmarkDominicaDominican RepublicEgypt, Arab Rep.El SalvadorEquatorial GuineaEstoniaEthiopiaFijiFinlandFranceGambia, TheGeorgiaGermanyGhanaGreeceGrenadaGuatemalaHondurasHong Kong SAR, ChinaHungaryIcelandIndiaIndonesiaIran, Islamic Rep.IraqIrelandIsraelItalyJamaicaJapanJordanKazakhstanKenyaKiribatiKorea, Rep.KuwaitKyrgyz RepublicLao PDRLatviaLebanonLiberiaLithuaniaLuxembourgMacedonia, FYRMadagascarMalawiMalaysiaMaldivesMaliMaltaMauritiusMexicoMicronesia, Fed. Sts.MoldovaMongoliaMoroccoMozambiqueMyanmarNamibiaNepalNetherlandsNew ZealandNicaraguaNorwayOmanPakistanPanamaPapua New GuineaParaguayPeruPhilippinesPolandPortugalQatarRomaniaRussian FederationRwandaSamoaSan MarinoSao Tome and PrincipeSenegalSerbiaSeychellesSierra LeoneSingaporeSlovak RepublicSloveniaSolomon IslandsSouth AfricaSpainSri LankaSt. Kitts and NevisSt. LuciaSurinameSwazilandSwedenSwitzerlandSyrian Arab RepublicTajikistanTanzaniaThailandTogoTrinidad and TobagoTunisiaTurkeyUgandaUkraineUnited Arab EmiratesUnited KingdomUnited StatesUruguayVanuatuVenezuela, RBVietnamWest Bank and GazaYemen, Rep.ZambiaZimbabwe Timeline:
This timeline shows a graph from 1991 to 2005 of Argentina. No data until 1990. Number of actual observations by date: 15.
Source name:
World Development Indicators
Source organization:
International Monetary Fund, Government Finance Statistics Yearbook and data files.
Categories, topics:
Public Sector, Trade
Last updated:
apr 23, 2017
Indicators value changes by year
Maximum:
11.526
jan 1, 1993
At the date of observation
Value
Absolute change
Change from previous value
jan 1, 1991
4.975
+4.975
0.0%
jan 1, 1992
6.614
+1.639
32.95%
jan 1, 1993
11.526
+4.913
74.28%
jan 1, 1994
8.497
-3.029
-26.28%
jan 1, 1995
8.067
-0.43
-5.06%
jan 1, 1996
7.68
-0.387
-4.79%
jan 1, 1997
8.67
+0.99
12.89%
jan 1, 1998
10.335
+1.665
19.21%
jan 1, 1999
9.62
-0.715
-6.92%
jan 1, 2000
8.296
-1.324
-13.76%
jan 1, 2001
6.951
-1.345
-16.21%
jan 1, 2002
5.991
-0.961
-13.82%
jan 1, 2003
4.057
-1.934
-32.28%
jan 1, 2004
4.701
+0.645
15.89%
jan 1, 2005
4.936
+0.235
5.0%
Ranking of countries by current statistics by years


Comments: