29
/
en
AIzaSyAYiBZKx7MnpbEhh9jyipgxe19OcubqV5w
April 1, 2024
273391
Ukraine
UKR
true
2
1
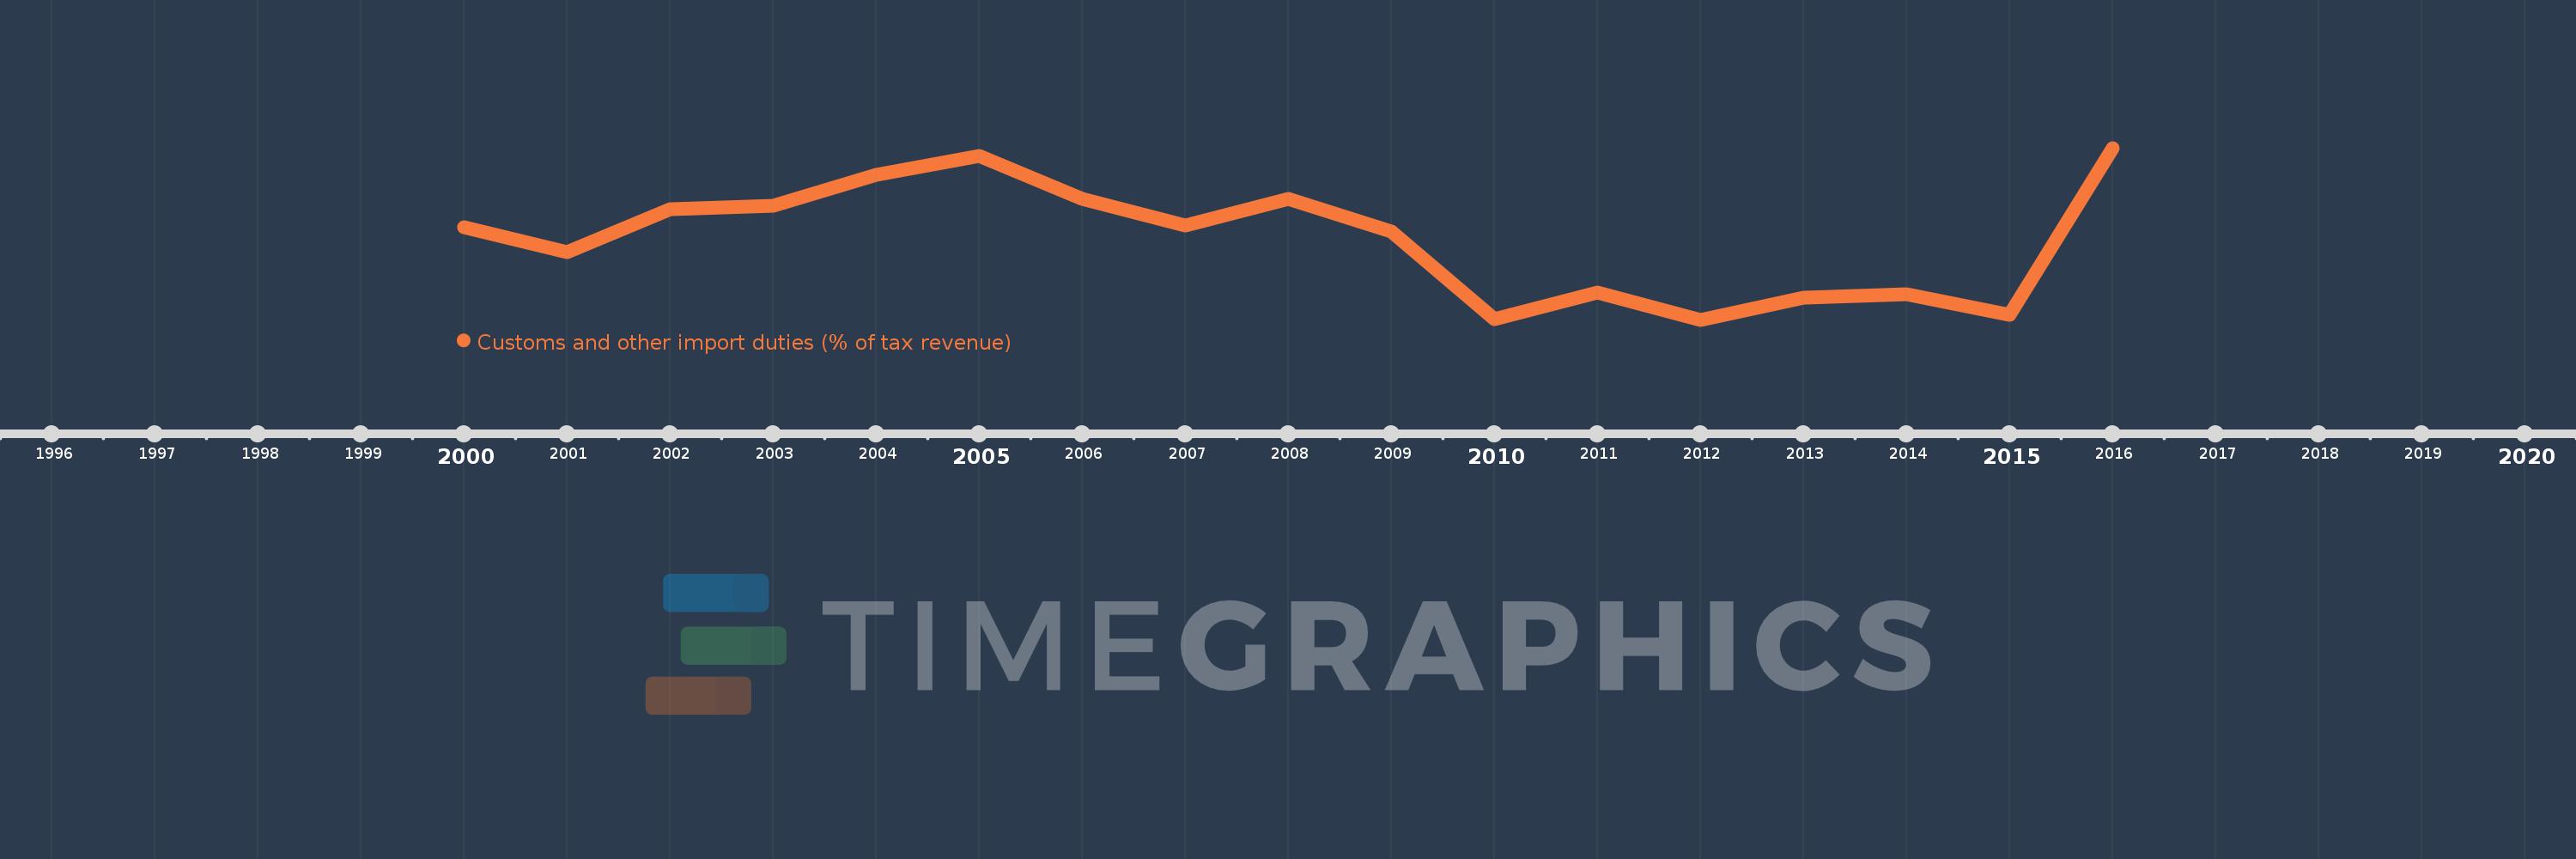
Customs and other import duties (% of tax revenue)
2016,2015,2014,2013,2012,2011,2010,2009,2008,2007,2006,2005,2004,2003,2002,2001,2000
This statistics in other country:
AfghanistanAlbaniaAlgeriaAngolaAntigua and BarbudaArgentinaArmeniaAustraliaAustriaAzerbaijanBahamas, TheBahrainBangladeshBarbadosBelarusBelizeBeninBhutanBoliviaBosnia and HerzegovinaBotswanaBrazilBulgariaBurkina FasoBurundiCabo VerdeCambodiaCentral African RepublicChileChinaColombiaCongo, Dem. Rep.Congo, Rep.Costa RicaCote d'IvoireCroatiaCyprusCzech RepublicDenmarkDominicaDominican RepublicEgypt, Arab Rep.El SalvadorEquatorial GuineaEstoniaEthiopiaFijiFinlandFranceGambia, TheGeorgiaGermanyGhanaGreeceGrenadaGuatemalaHondurasHong Kong SAR, ChinaHungaryIcelandIndiaIndonesiaIran, Islamic Rep.IraqIrelandIsraelItalyJamaicaJapanJordanKazakhstanKenyaKiribatiKorea, Rep.KuwaitKyrgyz RepublicLao PDRLatviaLebanonLiberiaLithuaniaLuxembourgMacedonia, FYRMadagascarMalawiMalaysiaMaldivesMaliMaltaMauritiusMexicoMicronesia, Fed. Sts.MoldovaMongoliaMoroccoMozambiqueMyanmarNamibiaNepalNetherlandsNew ZealandNicaraguaNorwayOmanPakistanPanamaPapua New GuineaParaguayPeruPhilippinesPolandPortugalQatarRomaniaRussian FederationRwandaSamoaSan MarinoSao Tome and PrincipeSenegalSerbiaSeychellesSierra LeoneSingaporeSlovak RepublicSloveniaSolomon IslandsSouth AfricaSpainSri LankaSt. Kitts and NevisSt. LuciaSurinameSwazilandSwedenSwitzerlandSyrian Arab RepublicTajikistanTanzaniaThailandTogoTrinidad and TobagoTunisiaTurkeyUgandaUkraineUnited Arab EmiratesUnited KingdomUnited StatesUruguayVanuatuVenezuela, RBVietnamWest Bank and GazaYemen, Rep.ZambiaZimbabwe Timeline:
This timeline shows a graph from 2000 to 2016 of Ukraine. No data until 1999. Number of actual observations by date: 17.
Source name:
World Development Indicators
Source organization:
International Monetary Fund, Government Finance Statistics Yearbook and data files.
Categories, topics:
Public Sector, Trade
Last updated:
apr 23, 2017
Indicators value changes by year
At the date of observation
Value
Absolute change
Change from previous value
jan 1, 2000
7.297
+7.297
0.0%
jan 1, 2001
6.485
-0.812
-11.13%
jan 1, 2002
7.869
+1.384
21.35%
jan 1, 2003
7.971
+0.102
1.29%
jan 1, 2004
8.961
+0.99
12.42%
jan 1, 2005
9.544
+0.584
6.51%
jan 1, 2006
8.201
-1.344
-14.08%
jan 1, 2007
7.353
-0.848
-10.34%
jan 1, 2008
8.201
+0.848
11.53%
jan 1, 2009
7.147
-1.055
-12.86%
jan 1, 2010
4.375
-2.771
-38.78%
jan 1, 2011
5.22
+0.845
19.31%
jan 1, 2012
4.347
-0.873
-16.73%
jan 1, 2013
5.047
+0.7
16.11%
jan 1, 2014
5.155
+0.108
2.14%
jan 1, 2015
4.514
-0.641
-12.44%
jan 1, 2016
9.806
+5.292
117.24%
Ranking of countries by current statistics by years


Comments: