29
/
en
AIzaSyAYiBZKx7MnpbEhh9jyipgxe19OcubqV5w
April 1, 2024
94692
Burkina Faso
BFA
true
2
1
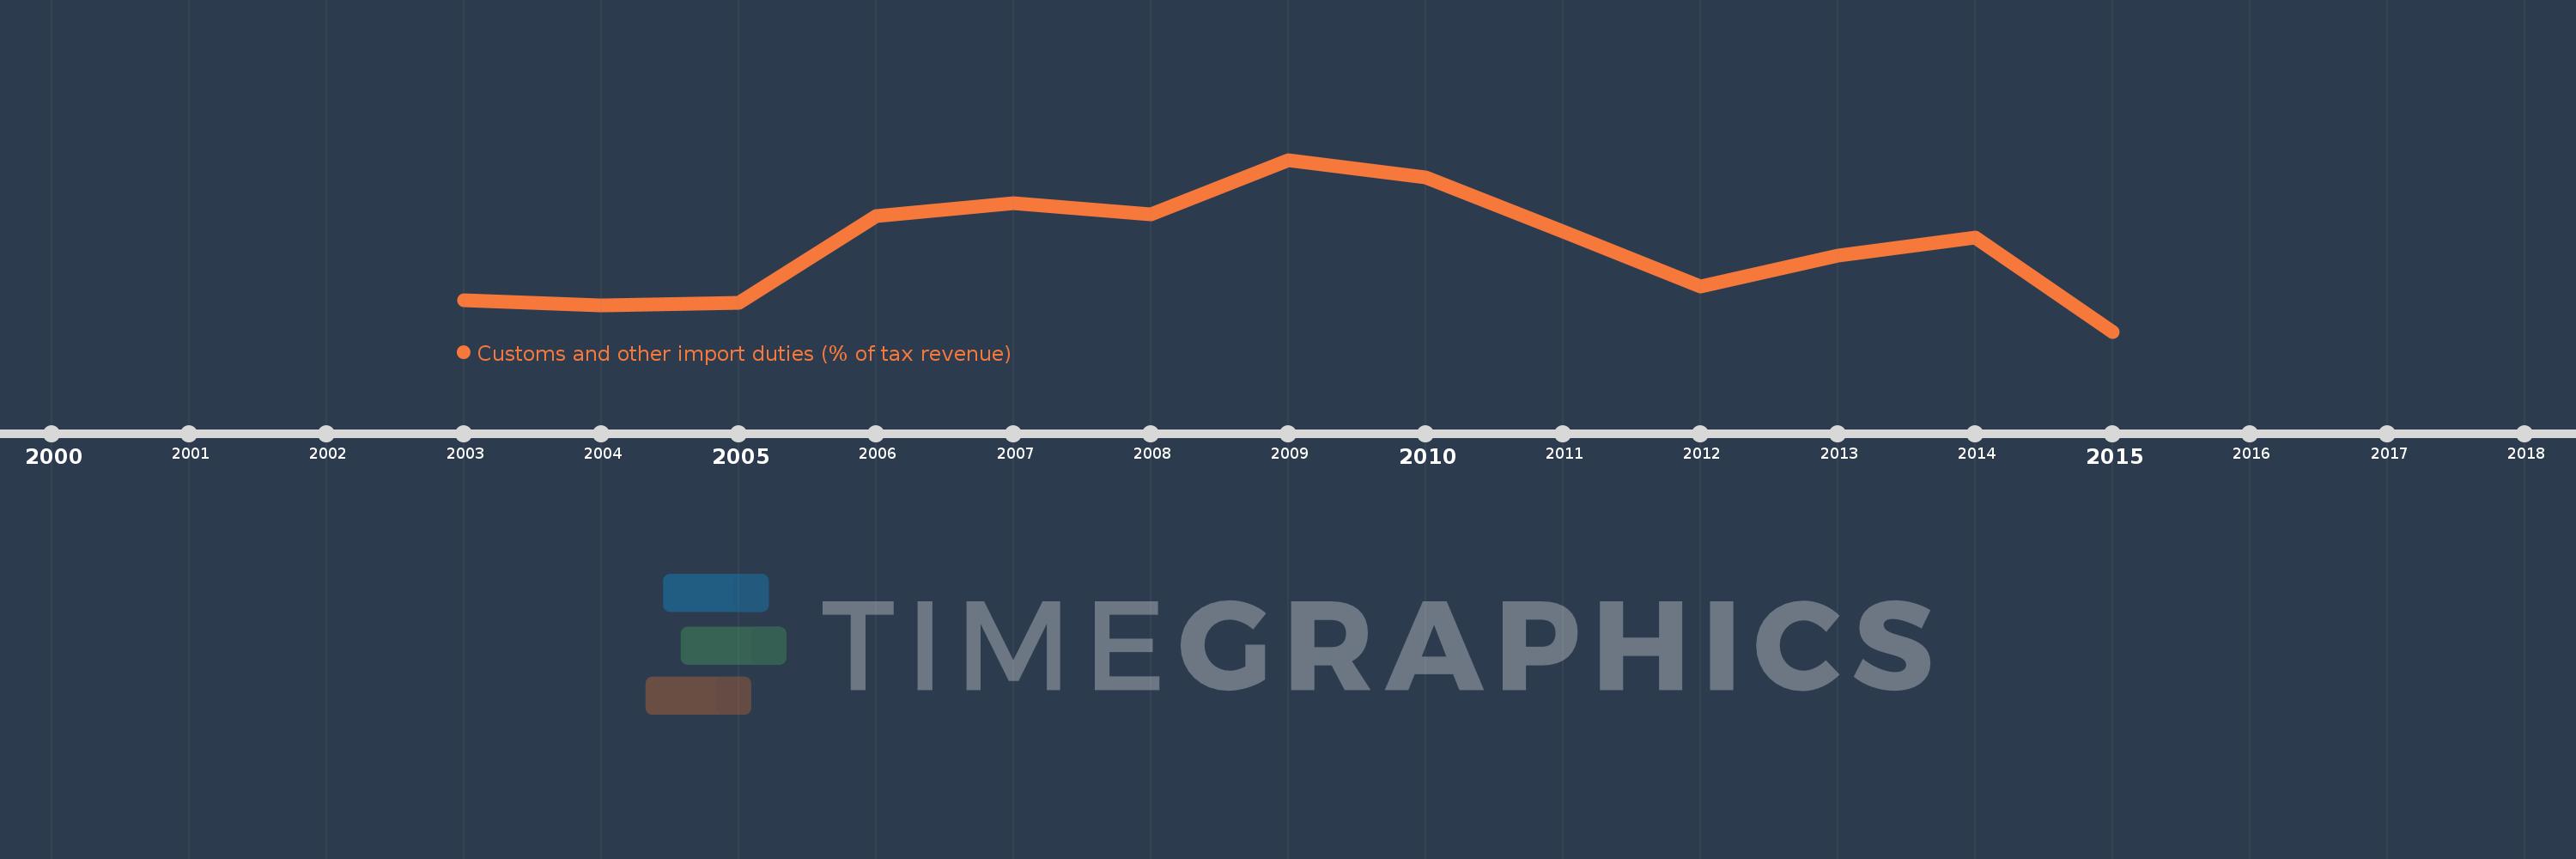
Customs and other import duties (% of tax revenue)
2015,2014,2013,2012,2011,2010,2009,2008,2007,2006,2005,2004,2003
This statistics in other country:
AfghanistanAlbaniaAlgeriaAngolaAntigua and BarbudaArgentinaArmeniaAustraliaAustriaAzerbaijanBahamas, TheBahrainBangladeshBarbadosBelarusBelizeBeninBhutanBoliviaBosnia and HerzegovinaBotswanaBrazilBulgariaBurkina FasoBurundiCabo VerdeCambodiaCentral African RepublicChileChinaColombiaCongo, Dem. Rep.Congo, Rep.Costa RicaCote d'IvoireCroatiaCyprusCzech RepublicDenmarkDominicaDominican RepublicEgypt, Arab Rep.El SalvadorEquatorial GuineaEstoniaEthiopiaFijiFinlandFranceGambia, TheGeorgiaGermanyGhanaGreeceGrenadaGuatemalaHondurasHong Kong SAR, ChinaHungaryIcelandIndiaIndonesiaIran, Islamic Rep.IraqIrelandIsraelItalyJamaicaJapanJordanKazakhstanKenyaKiribatiKorea, Rep.KuwaitKyrgyz RepublicLao PDRLatviaLebanonLiberiaLithuaniaLuxembourgMacedonia, FYRMadagascarMalawiMalaysiaMaldivesMaliMaltaMauritiusMexicoMicronesia, Fed. Sts.MoldovaMongoliaMoroccoMozambiqueMyanmarNamibiaNepalNetherlandsNew ZealandNicaraguaNorwayOmanPakistanPanamaPapua New GuineaParaguayPeruPhilippinesPolandPortugalQatarRomaniaRussian FederationRwandaSamoaSan MarinoSao Tome and PrincipeSenegalSerbiaSeychellesSierra LeoneSingaporeSlovak RepublicSloveniaSolomon IslandsSouth AfricaSpainSri LankaSt. Kitts and NevisSt. LuciaSurinameSwazilandSwedenSwitzerlandSyrian Arab RepublicTajikistanTanzaniaThailandTogoTrinidad and TobagoTunisiaTurkeyUgandaUkraineUnited Arab EmiratesUnited KingdomUnited StatesUruguayVanuatuVenezuela, RBVietnamWest Bank and GazaYemen, Rep.ZambiaZimbabwe Timeline:
This timeline shows a graph from 2003 to 2015 of Burkina Faso. No data until 2002. Number of actual observations by date: 13.
Source name:
World Development Indicators
Source organization:
International Monetary Fund, Government Finance Statistics Yearbook and data files.
Categories, topics:
Public Sector, Trade
Last updated:
apr 23, 2017
Indicators value changes by year
Minimum:
15.197
jan 1, 2015
Maximum:
18.313
jan 1, 2009
At the date of observation
Value
Absolute change
Change from previous value
jan 1, 2003
15.772
+15.772
0.0%
jan 1, 2004
15.673
-0.099
-0.63%
jan 1, 2005
15.722
+0.049
0.31%
jan 1, 2006
17.287
+1.565
9.96%
jan 1, 2007
17.523
+0.236
1.36%
jan 1, 2008
17.32
-0.203
-1.16%
jan 1, 2009
18.313
+0.993
5.73%
jan 1, 2010
18.0
-0.313
-1.71%
jan 1, 2011
17.019
-0.981
-5.45%
jan 1, 2012
16.018
-1.001
-5.88%
jan 1, 2013
16.575
+0.556
3.47%
jan 1, 2014
16.902
+0.327
1.97%
jan 1, 2015
15.197
-1.705
-10.09%
Ranking of countries by current statistics by years


Comments: