29
/
en
AIzaSyAYiBZKx7MnpbEhh9jyipgxe19OcubqV5w
April 1, 2024
59838
Sub-Saharan Africa (excluding high income)
SSA
false
2
1
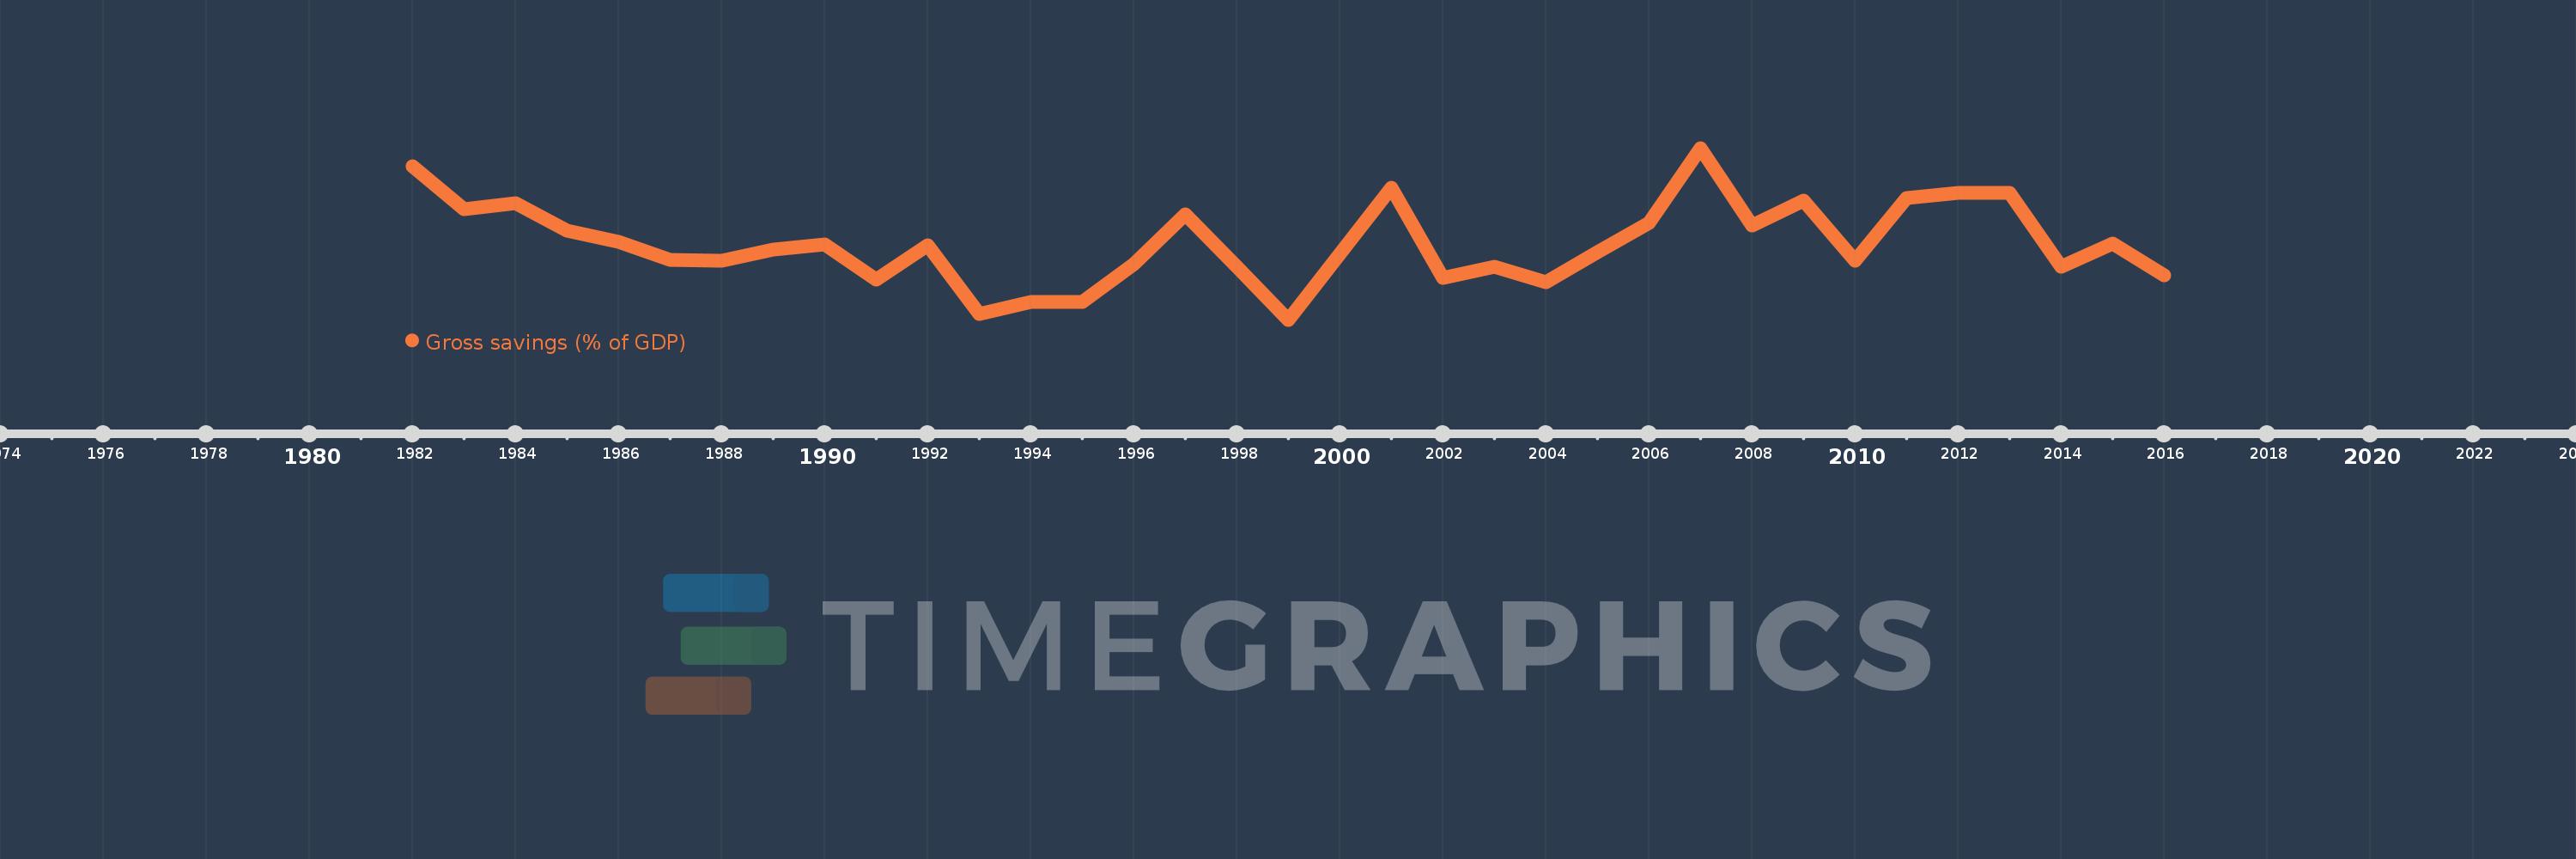
Gross savings (% of GDP)
2016,2015,2014,2013,2012,2011,2010,2009,2008,2007,2006,2005,2004,2003,2002,2001,1999,1998,1997,1996,1995,1994,1993,1992,1991,1990,1989,1988,1987,1986,1985,1984,1983,1982
This statistics in other country:
AfghanistanAlbaniaAlgeriaAngolaAntigua and BarbudaArab WorldArgentinaArmeniaAustraliaAustriaAzerbaijanBahamas, TheBahrainBangladeshBarbadosBelarusBelgiumBelizeBeninBermudaBhutanBoliviaBosnia and HerzegovinaBotswanaBrazilBrunei DarussalamBulgariaBurkina FasoBurundiCabo VerdeCambodiaCameroonCanadaCaribbean small statesCentral African RepublicCentral Europe and the BalticsChadChileChinaColombiaComorosCongo, Dem. Rep.Congo, Rep.Costa RicaCote d'IvoireCroatiaCyprusCzech RepublicDenmarkDjiboutiDominicaDominican RepublicEarly-demographic dividendEast Asia & PacificEast Asia & Pacific (excluding high income)East Asia & Pacific (IDA & IBRD countries)EcuadorEgypt, Arab Rep.El SalvadorEquatorial GuineaEritreaEstoniaEthiopiaEuro areaEurope & Central AsiaEurope & Central Asia (excluding high income)Europe & Central Asia (IDA & IBRD countries)European UnionFaroe IslandsFijiFinlandFragile and conflict affected situationsFranceGabonGambia, TheGeorgiaGermanyGhanaGreeceGrenadaGuatemalaGuineaGuinea-BissauGuyanaHaitiHeavily indebted poor countries (HIPC)High incomeHondurasHong Kong SAR, ChinaHungaryIBRD onlyIcelandIDA & IBRD totalIDA blendIDA onlyIDA totalIndiaIndonesiaIran, Islamic Rep.IraqIrelandIsraelItalyJamaicaJapanJordanKazakhstanKenyaKiribatiKorea, Rep.KosovoKuwaitKyrgyz RepublicLao PDRLate-demographic dividendLatin America & Caribbean Latin America & Caribbean (excluding high income)Latin America & the Caribbean (IDA & IBRD countries)LatviaLeast developed countries: UN classificationLebanonLesothoLiberiaLibyaLithuaniaLow & middle incomeLow incomeLower middle incomeLuxembourgMacao SAR, ChinaMacedonia, FYRMadagascarMalawiMalaysiaMaldivesMaliMaltaMauritaniaMauritiusMexicoMiddle East & North AfricaMiddle East & North Africa (excluding high income)Middle East & North Africa (IDA & IBRD countries)Middle incomeMoldovaMongoliaMontenegroMoroccoMozambiqueNamibiaNepalNetherlandsNew ZealandNicaraguaNigerNigeriaNorth AmericaNorwayOECD membersOmanOther small statesPacific island small statesPakistanPanamaPapua New GuineaParaguayPeruPhilippinesPolandPortugalPost-demographic dividendPre-demographic dividendQatarRomaniaRussian FederationRwandaSaudi ArabiaSenegalSerbiaSeychellesSierra LeoneSingaporeSlovak RepublicSloveniaSmall statesSolomon IslandsSouth AfricaSouth AsiaSouth Asia (IDA & IBRD)South SudanSpainSri LankaSt. Kitts and NevisSt. LuciaSt. Vincent and the GrenadinesSub-Saharan Africa Sub-Saharan Africa (excluding high income)Sub-Saharan Africa (IDA & IBRD countries)SudanSurinameSwazilandSwedenSwitzerlandSyrian Arab RepublicTajikistanTanzaniaThailandTimor-LesteTogoTongaTrinidad and TobagoTunisiaTurkeyUgandaUkraineUnited KingdomUnited StatesUpper middle incomeUruguayVanuatuVenezuela, RBVietnamWest Bank and GazaWorldYemen, Rep.ZambiaZimbabwe Timeline:
This timeline shows a graph from 1982 to 2016 of Sub-Saharan Africa (excluding high income). No data until 1981. Number of actual observations by date: 34.
Source name:
World Development Indicators
Source organization:
World Bank national accounts data, and OECD National Accounts data files.
Categories, topics:
Economy & Growth
Last updated:
apr 23, 2017
Indicators value changes by year
Minimum:
10.422
jan 1, 1999
Maximum:
23.498
jan 1, 2007
At the date of observation
Value
Absolute change
Change from previous value
jan 1, 1982
22.108
+22.108
0.0%
jan 1, 1983
18.847
-3.261
-14.75%
jan 1, 1984
19.32
+0.473
2.51%
jan 1, 1985
17.208
-2.112
-10.93%
jan 1, 1986
16.384
-0.824
-4.79%
jan 1, 1987
14.973
-1.411
-8.61%
jan 1, 1988
14.905
-0.068
-0.45%
jan 1, 1989
15.753
+0.848
5.69%
jan 1, 1990
16.135
+0.382
2.42%
jan 1, 1991
13.502
-2.632
-16.32%
jan 1, 1992
16.084
+2.582
19.12%
jan 1, 1993
10.888
-5.196
-32.3%
jan 1, 1994
11.769
+0.881
8.09%
jan 1, 1995
11.804
+0.035
0.29%
jan 1, 1996
14.627
+2.823
23.92%
jan 1, 1997
18.442
+3.815
26.08%
jan 1, 1998
14.478
-3.964
-21.5%
jan 1, 1999
10.422
-4.056
-28.02%
jan 1, 2001
20.459
+10.038
96.31%
jan 1, 2002
13.599
-6.861
-33.53%
jan 1, 2003
14.45
+0.851
6.26%
jan 1, 2004
13.308
-1.142
-7.9%
jan 1, 2005
15.547
+2.239
16.82%
jan 1, 2006
17.822
+2.275
14.63%
jan 1, 2007
23.498
+5.675
31.84%
jan 1, 2008
17.573
-5.924
-25.21%
jan 1, 2009
19.501
+1.927
10.97%
jan 1, 2010
14.886
-4.615
-23.66%
jan 1, 2011
19.693
+4.807
32.29%
jan 1, 2012
20.104
+0.411
2.09%
jan 1, 2013
20.076
-0.028
-0.14%
jan 1, 2014
14.454
-5.622
-28.0%
jan 1, 2015
16.216
+1.762
12.19%
jan 1, 2016
13.805
-2.411
-14.87%
Ranking of countries by current statistics by years


Comments: