29
/
en
AIzaSyAYiBZKx7MnpbEhh9jyipgxe19OcubqV5w
April 1, 2024
38207
IDA blend
IDB
false
2
1
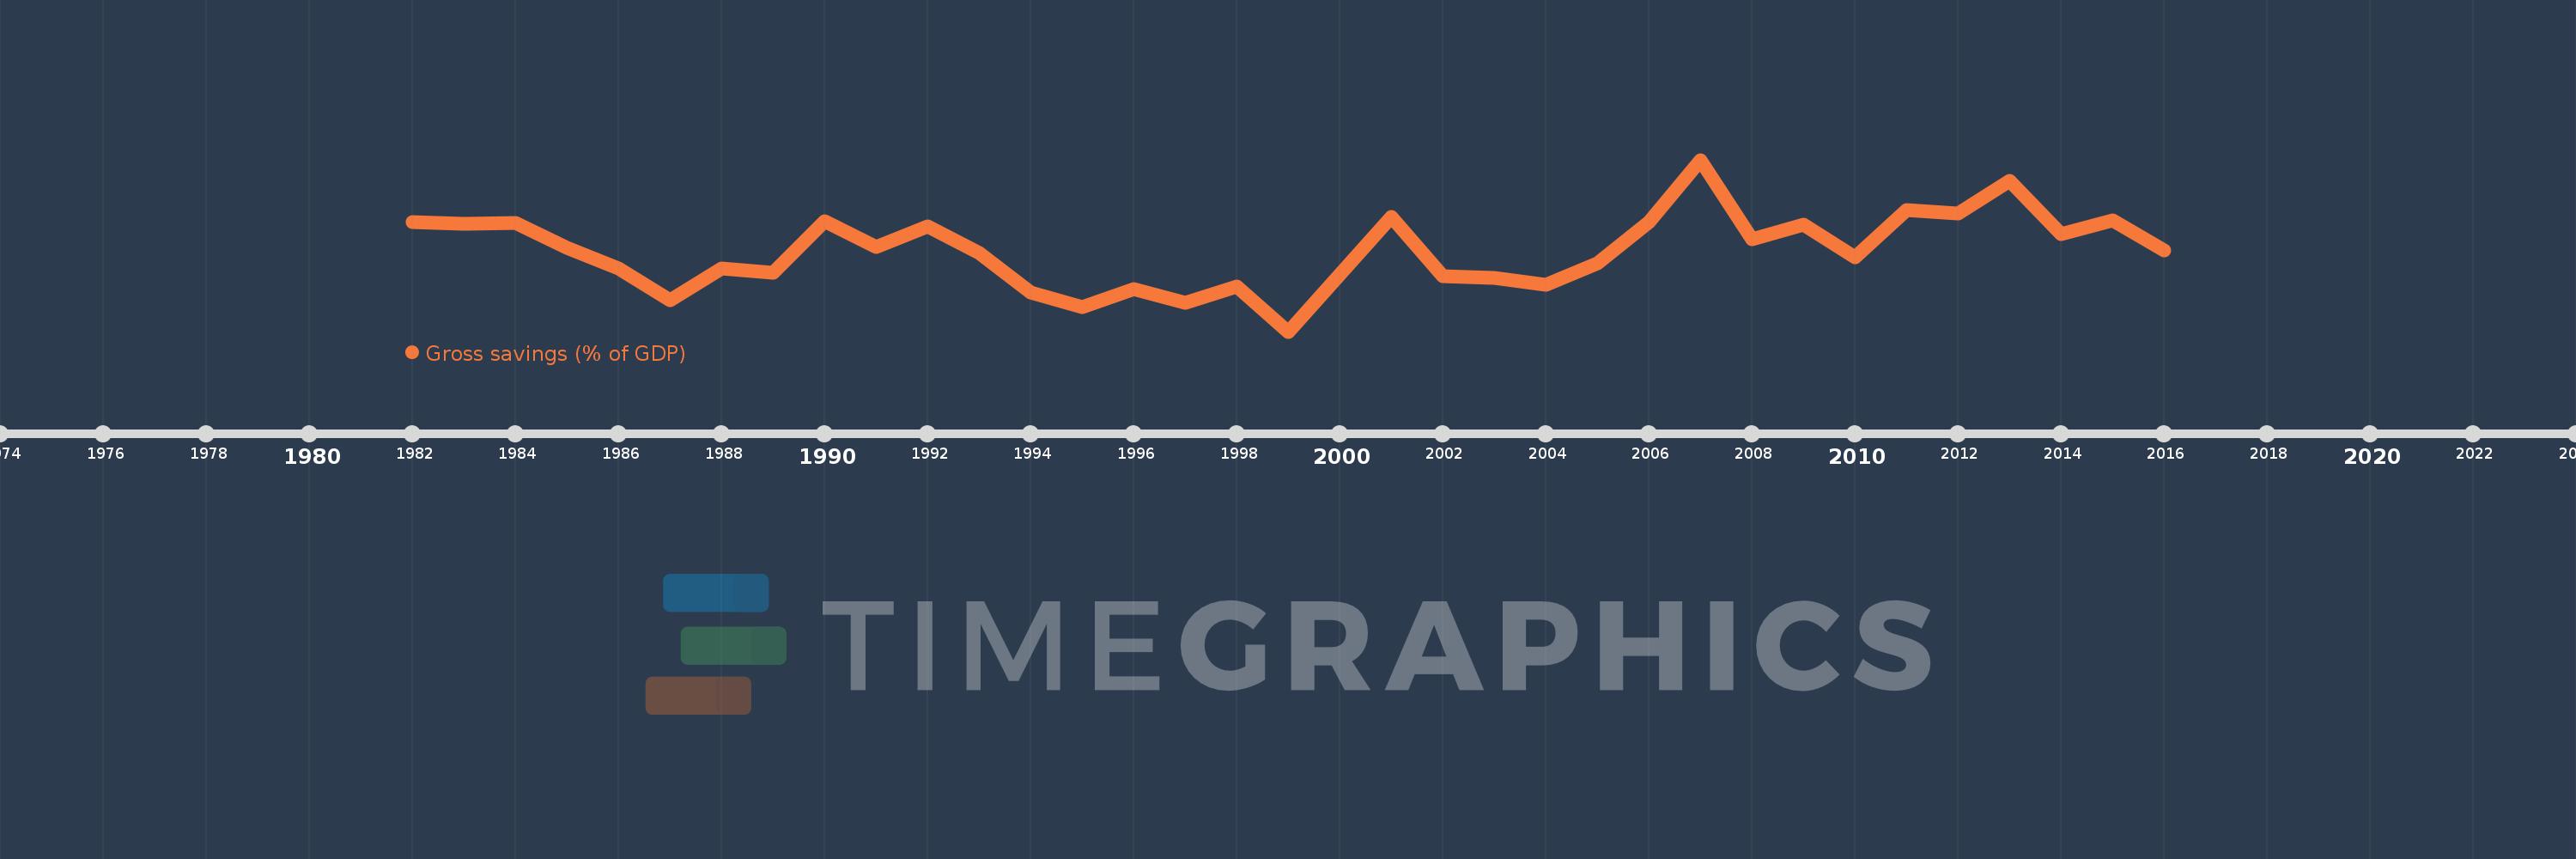
Gross savings (% of GDP)
2016,2015,2014,2013,2012,2011,2010,2009,2008,2007,2006,2005,2004,2003,2002,2001,1999,1998,1997,1996,1995,1994,1993,1992,1991,1990,1989,1988,1987,1986,1985,1984,1983,1982
This statistics in other country:
AfghanistanAlbaniaAlgeriaAngolaAntigua and BarbudaArab WorldArgentinaArmeniaAustraliaAustriaAzerbaijanBahamas, TheBahrainBangladeshBarbadosBelarusBelgiumBelizeBeninBermudaBhutanBoliviaBosnia and HerzegovinaBotswanaBrazilBrunei DarussalamBulgariaBurkina FasoBurundiCabo VerdeCambodiaCameroonCanadaCaribbean small statesCentral African RepublicCentral Europe and the BalticsChadChileChinaColombiaComorosCongo, Dem. Rep.Congo, Rep.Costa RicaCote d'IvoireCroatiaCyprusCzech RepublicDenmarkDjiboutiDominicaDominican RepublicEarly-demographic dividendEast Asia & PacificEast Asia & Pacific (excluding high income)East Asia & Pacific (IDA & IBRD countries)EcuadorEgypt, Arab Rep.El SalvadorEquatorial GuineaEritreaEstoniaEthiopiaEuro areaEurope & Central AsiaEurope & Central Asia (excluding high income)Europe & Central Asia (IDA & IBRD countries)European UnionFaroe IslandsFijiFinlandFragile and conflict affected situationsFranceGabonGambia, TheGeorgiaGermanyGhanaGreeceGrenadaGuatemalaGuineaGuinea-BissauGuyanaHaitiHeavily indebted poor countries (HIPC)High incomeHondurasHong Kong SAR, ChinaHungaryIBRD onlyIcelandIDA & IBRD totalIDA blendIDA onlyIDA totalIndiaIndonesiaIran, Islamic Rep.IraqIrelandIsraelItalyJamaicaJapanJordanKazakhstanKenyaKiribatiKorea, Rep.KosovoKuwaitKyrgyz RepublicLao PDRLate-demographic dividendLatin America & Caribbean Latin America & Caribbean (excluding high income)Latin America & the Caribbean (IDA & IBRD countries)LatviaLeast developed countries: UN classificationLebanonLesothoLiberiaLibyaLithuaniaLow & middle incomeLow incomeLower middle incomeLuxembourgMacao SAR, ChinaMacedonia, FYRMadagascarMalawiMalaysiaMaldivesMaliMaltaMauritaniaMauritiusMexicoMiddle East & North AfricaMiddle East & North Africa (excluding high income)Middle East & North Africa (IDA & IBRD countries)Middle incomeMoldovaMongoliaMontenegroMoroccoMozambiqueNamibiaNepalNetherlandsNew ZealandNicaraguaNigerNigeriaNorth AmericaNorwayOECD membersOmanOther small statesPacific island small statesPakistanPanamaPapua New GuineaParaguayPeruPhilippinesPolandPortugalPost-demographic dividendPre-demographic dividendQatarRomaniaRussian FederationRwandaSaudi ArabiaSenegalSerbiaSeychellesSierra LeoneSingaporeSlovak RepublicSloveniaSmall statesSolomon IslandsSouth AfricaSouth AsiaSouth Asia (IDA & IBRD)South SudanSpainSri LankaSt. Kitts and NevisSt. LuciaSt. Vincent and the GrenadinesSub-Saharan Africa Sub-Saharan Africa (excluding high income)Sub-Saharan Africa (IDA & IBRD countries)SudanSurinameSwazilandSwedenSwitzerlandSyrian Arab RepublicTajikistanTanzaniaThailandTimor-LesteTogoTongaTrinidad and TobagoTunisiaTurkeyUgandaUkraineUnited KingdomUnited StatesUpper middle incomeUruguayVanuatuVenezuela, RBVietnamWest Bank and GazaWorldYemen, Rep.ZambiaZimbabwe Timeline:
This timeline shows a graph from 1982 to 2016 of IDA blend. No data until 1981. Number of actual observations by date: 34.
Source name:
World Development Indicators
Source organization:
World Bank national accounts data, and OECD National Accounts data files.
Categories, topics:
Economy & Growth
Last updated:
apr 23, 2017
Indicators value changes by year
Minimum:
12.364
jan 1, 1999
Maximum:
30.923
jan 1, 2007
At the date of observation
Value
Absolute change
Change from previous value
jan 1, 1982
24.171
+24.171
0.0%
jan 1, 1983
24.049
-0.122
-0.5%
jan 1, 1984
24.092
+0.043
0.18%
jan 1, 1985
21.432
-2.661
-11.04%
jan 1, 1986
19.159
-2.273
-10.6%
jan 1, 1987
15.754
-3.405
-17.77%
jan 1, 1988
19.184
+3.43
21.77%
jan 1, 1989
18.692
-0.492
-2.56%
jan 1, 1990
24.305
+5.614
30.03%
jan 1, 1991
21.524
-2.782
-11.44%
jan 1, 1992
23.768
+2.245
10.43%
jan 1, 1993
20.88
-2.888
-12.15%
jan 1, 1994
16.54
-4.34
-20.79%
jan 1, 1995
14.971
-1.569
-9.48%
jan 1, 1996
16.93
+1.96
13.09%
jan 1, 1997
15.446
-1.484
-8.77%
jan 1, 1998
17.22
+1.774
11.49%
jan 1, 1999
12.364
-4.856
-28.2%
jan 1, 2001
24.761
+12.397
100.27%
jan 1, 2002
18.385
-6.376
-25.75%
jan 1, 2003
18.175
-0.21
-1.14%
jan 1, 2004
17.445
-0.729
-4.01%
jan 1, 2005
19.77
+2.325
13.33%
jan 1, 2006
24.219
+4.449
22.5%
jan 1, 2007
30.923
+6.703
27.68%
jan 1, 2008
22.324
-8.599
-27.81%
jan 1, 2009
23.899
+1.575
7.06%
jan 1, 2010
20.356
-3.543
-14.83%
jan 1, 2011
25.531
+5.175
25.42%
jan 1, 2012
25.125
-0.406
-1.59%
jan 1, 2013
28.639
+3.514
13.99%
jan 1, 2014
22.887
-5.753
-20.09%
jan 1, 2015
24.427
+1.54
6.73%
jan 1, 2016
21.111
-3.316
-13.58%
Ranking of countries by current statistics by years


Comments: