29
/
en
AIzaSyAYiBZKx7MnpbEhh9jyipgxe19OcubqV5w
April 1, 2024
68873
Antigua and Barbuda
ATG
true
2
1
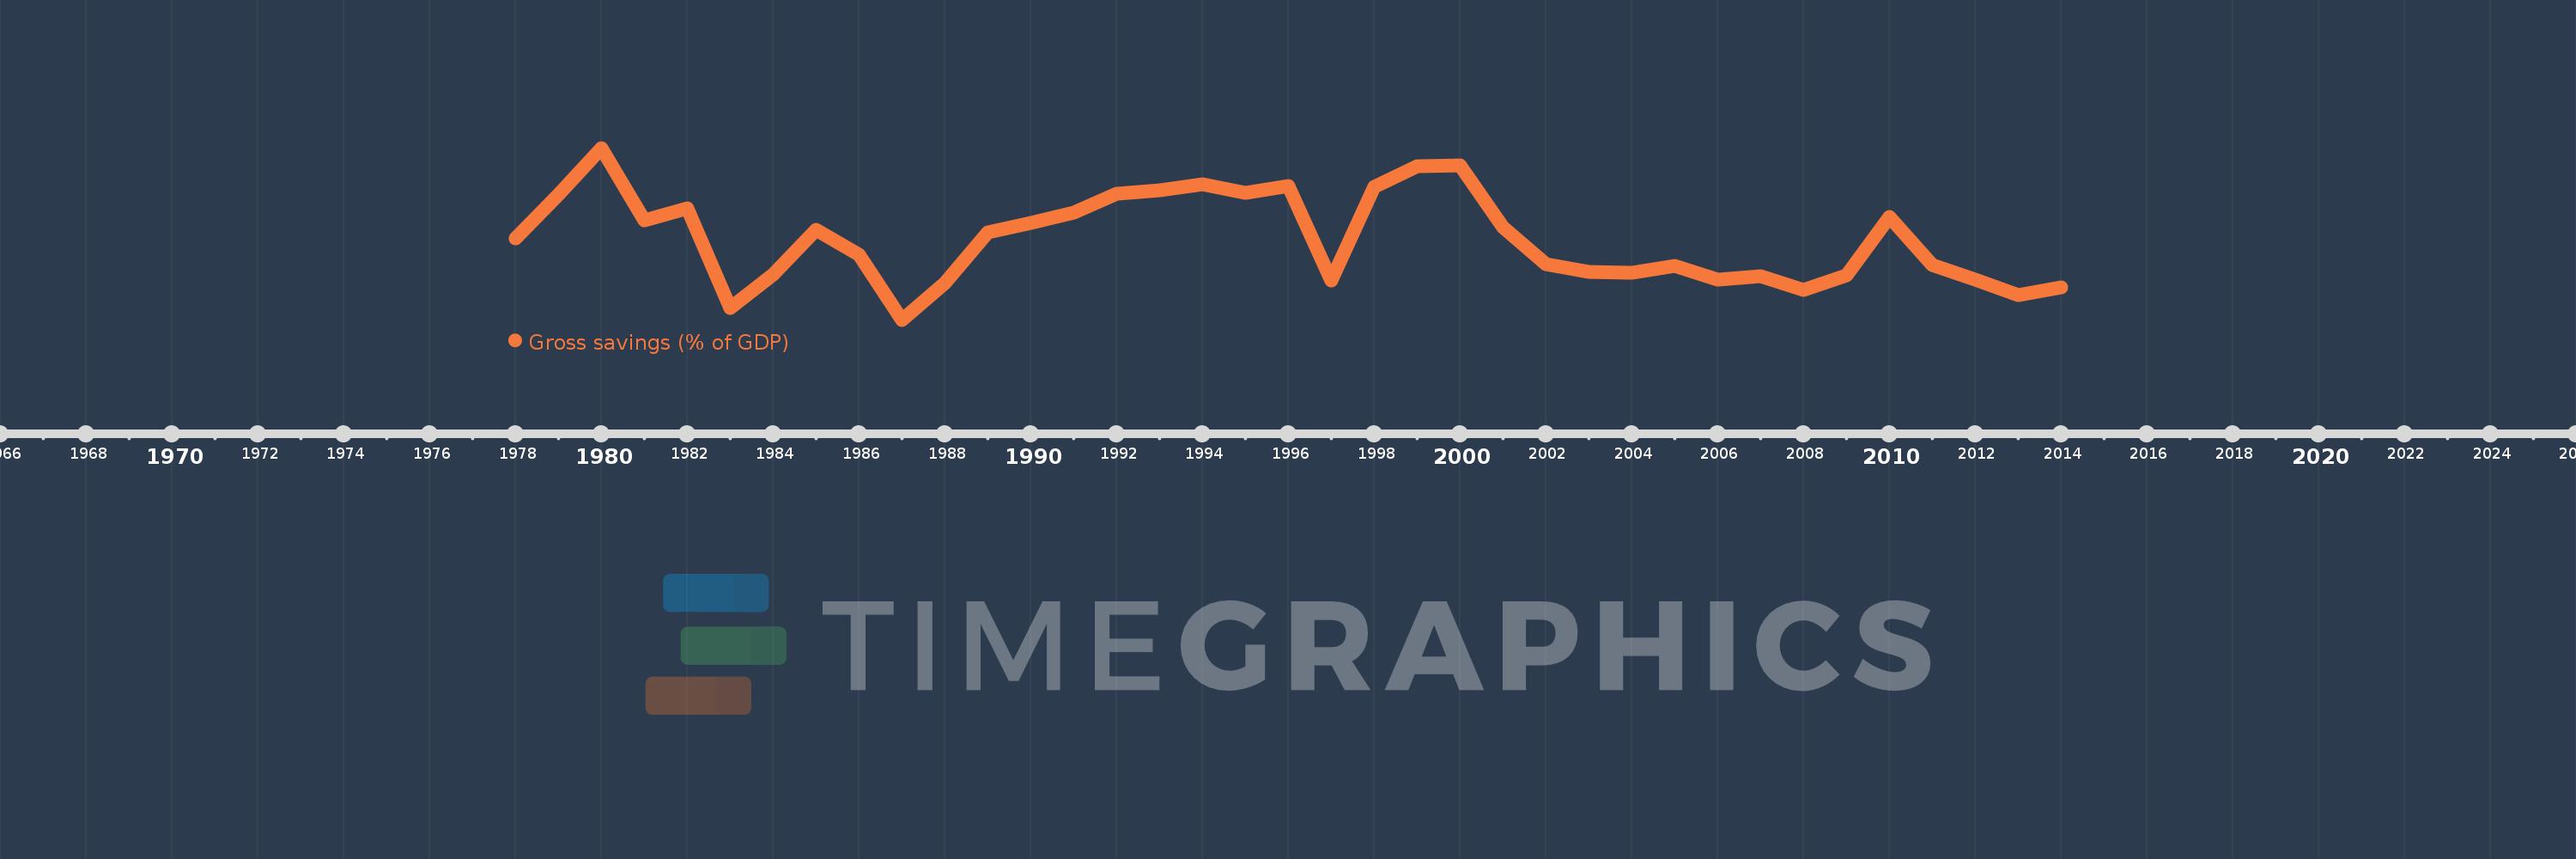
Gross savings (% of GDP)
2014,2013,2012,2011,2010,2009,2008,2007,2006,2005,2004,2003,2002,2001,2000,1999,1998,1997,1996,1995,1994,1993,1992,1991,1990,1989,1988,1987,1986,1985,1984,1983,1982,1981,1980,1979,1978
This statistics in other country:
AfghanistanAlbaniaAlgeriaAngolaAntigua and BarbudaArab WorldArgentinaArmeniaAustraliaAustriaAzerbaijanBahamas, TheBahrainBangladeshBarbadosBelarusBelgiumBelizeBeninBermudaBhutanBoliviaBosnia and HerzegovinaBotswanaBrazilBrunei DarussalamBulgariaBurkina FasoBurundiCabo VerdeCambodiaCameroonCanadaCaribbean small statesCentral African RepublicCentral Europe and the BalticsChadChileChinaColombiaComorosCongo, Dem. Rep.Congo, Rep.Costa RicaCote d'IvoireCroatiaCyprusCzech RepublicDenmarkDjiboutiDominicaDominican RepublicEarly-demographic dividendEast Asia & PacificEast Asia & Pacific (excluding high income)East Asia & Pacific (IDA & IBRD countries)EcuadorEgypt, Arab Rep.El SalvadorEquatorial GuineaEritreaEstoniaEthiopiaEuro areaEurope & Central AsiaEurope & Central Asia (excluding high income)Europe & Central Asia (IDA & IBRD countries)European UnionFaroe IslandsFijiFinlandFragile and conflict affected situationsFranceGabonGambia, TheGeorgiaGermanyGhanaGreeceGrenadaGuatemalaGuineaGuinea-BissauGuyanaHaitiHeavily indebted poor countries (HIPC)High incomeHondurasHong Kong SAR, ChinaHungaryIBRD onlyIcelandIDA & IBRD totalIDA blendIDA onlyIDA totalIndiaIndonesiaIran, Islamic Rep.IraqIrelandIsraelItalyJamaicaJapanJordanKazakhstanKenyaKiribatiKorea, Rep.KosovoKuwaitKyrgyz RepublicLao PDRLate-demographic dividendLatin America & Caribbean Latin America & Caribbean (excluding high income)Latin America & the Caribbean (IDA & IBRD countries)LatviaLeast developed countries: UN classificationLebanonLesothoLiberiaLibyaLithuaniaLow & middle incomeLow incomeLower middle incomeLuxembourgMacao SAR, ChinaMacedonia, FYRMadagascarMalawiMalaysiaMaldivesMaliMaltaMauritaniaMauritiusMexicoMiddle East & North AfricaMiddle East & North Africa (excluding high income)Middle East & North Africa (IDA & IBRD countries)Middle incomeMoldovaMongoliaMontenegroMoroccoMozambiqueNamibiaNepalNetherlandsNew ZealandNicaraguaNigerNigeriaNorth AmericaNorwayOECD membersOmanOther small statesPacific island small statesPakistanPanamaPapua New GuineaParaguayPeruPhilippinesPolandPortugalPost-demographic dividendPre-demographic dividendQatarRomaniaRussian FederationRwandaSaudi ArabiaSenegalSerbiaSeychellesSierra LeoneSingaporeSlovak RepublicSloveniaSmall statesSolomon IslandsSouth AfricaSouth AsiaSouth Asia (IDA & IBRD)South SudanSpainSri LankaSt. Kitts and NevisSt. LuciaSt. Vincent and the GrenadinesSub-Saharan Africa Sub-Saharan Africa (excluding high income)Sub-Saharan Africa (IDA & IBRD countries)SudanSurinameSwazilandSwedenSwitzerlandSyrian Arab RepublicTajikistanTanzaniaThailandTimor-LesteTogoTongaTrinidad and TobagoTunisiaTurkeyUgandaUkraineUnited KingdomUnited StatesUpper middle incomeUruguayVanuatuVenezuela, RBVietnamWest Bank and GazaWorldYemen, Rep.ZambiaZimbabwe Timeline:
This timeline shows a graph from 1978 to 2014 of Antigua and Barbuda. No data until 1977. Number of actual observations by date: 37.
Source name:
World Development Indicators
Source organization:
World Bank national accounts data, and OECD National Accounts data files.
Categories, topics:
Economy & Growth
Last updated:
apr 23, 2017
Indicators value changes by year
Maximum:
39.623
jan 1, 1980
At the date of observation
Value
Absolute change
Change from previous value
jan 1, 1978
19.648
+19.648
0.0%
jan 1, 1979
29.261
+9.613
48.92%
jan 1, 1980
39.623
+10.361
35.41%
jan 1, 1981
23.508
-16.115
-40.67%
jan 1, 1982
26.332
+2.825
12.02%
jan 1, 1983
4.258
-22.074
-83.83%
jan 1, 1984
11.582
+7.324
172.0%
jan 1, 1985
21.476
+9.894
85.42%
jan 1, 1986
15.907
-5.568
-25.93%
jan 1, 1987
1.6
-14.308
-89.94%
jan 1, 1988
9.705
+8.106
506.75%
jan 1, 1989
20.923
+11.218
115.58%
jan 1, 1990
22.974
+2.05
9.8%
jan 1, 1991
25.304
+2.33
10.14%
jan 1, 1992
29.466
+4.163
16.45%
jan 1, 1993
30.328
+0.862
2.92%
jan 1, 1994
31.588
+1.26
4.15%
jan 1, 1995
29.774
-1.814
-5.74%
jan 1, 1996
31.154
+1.38
4.64%
jan 1, 1997
10.303
-20.851
-66.93%
jan 1, 1998
31.087
+20.784
201.72%
jan 1, 1999
35.503
+4.416
14.21%
jan 1, 2000
35.834
+0.331
0.93%
jan 1, 2001
22.04
-13.794
-38.49%
jan 1, 2002
13.85
-8.191
-37.16%
jan 1, 2003
12.191
-1.658
-11.97%
jan 1, 2004
12.032
-0.159
-1.3%
jan 1, 2005
13.482
+1.45
12.05%
jan 1, 2006
10.403
-3.08
-22.84%
jan 1, 2007
11.198
+0.795
7.64%
jan 1, 2008
8.12
-3.078
-27.49%
jan 1, 2009
11.397
+3.278
40.36%
jan 1, 2010
24.366
+12.968
113.78%
jan 1, 2011
13.727
-10.639
-43.66%
jan 1, 2012
10.49
-3.237
-23.58%
jan 1, 2013
7.138
-3.352
-31.95%
jan 1, 2014
8.714
+1.575
22.07%
Ranking of countries by current statistics by years


Comments: