29
/
en
AIzaSyAYiBZKx7MnpbEhh9jyipgxe19OcubqV5w
April 1, 2024
219645
Papua New Guinea
PNG
true
2
1
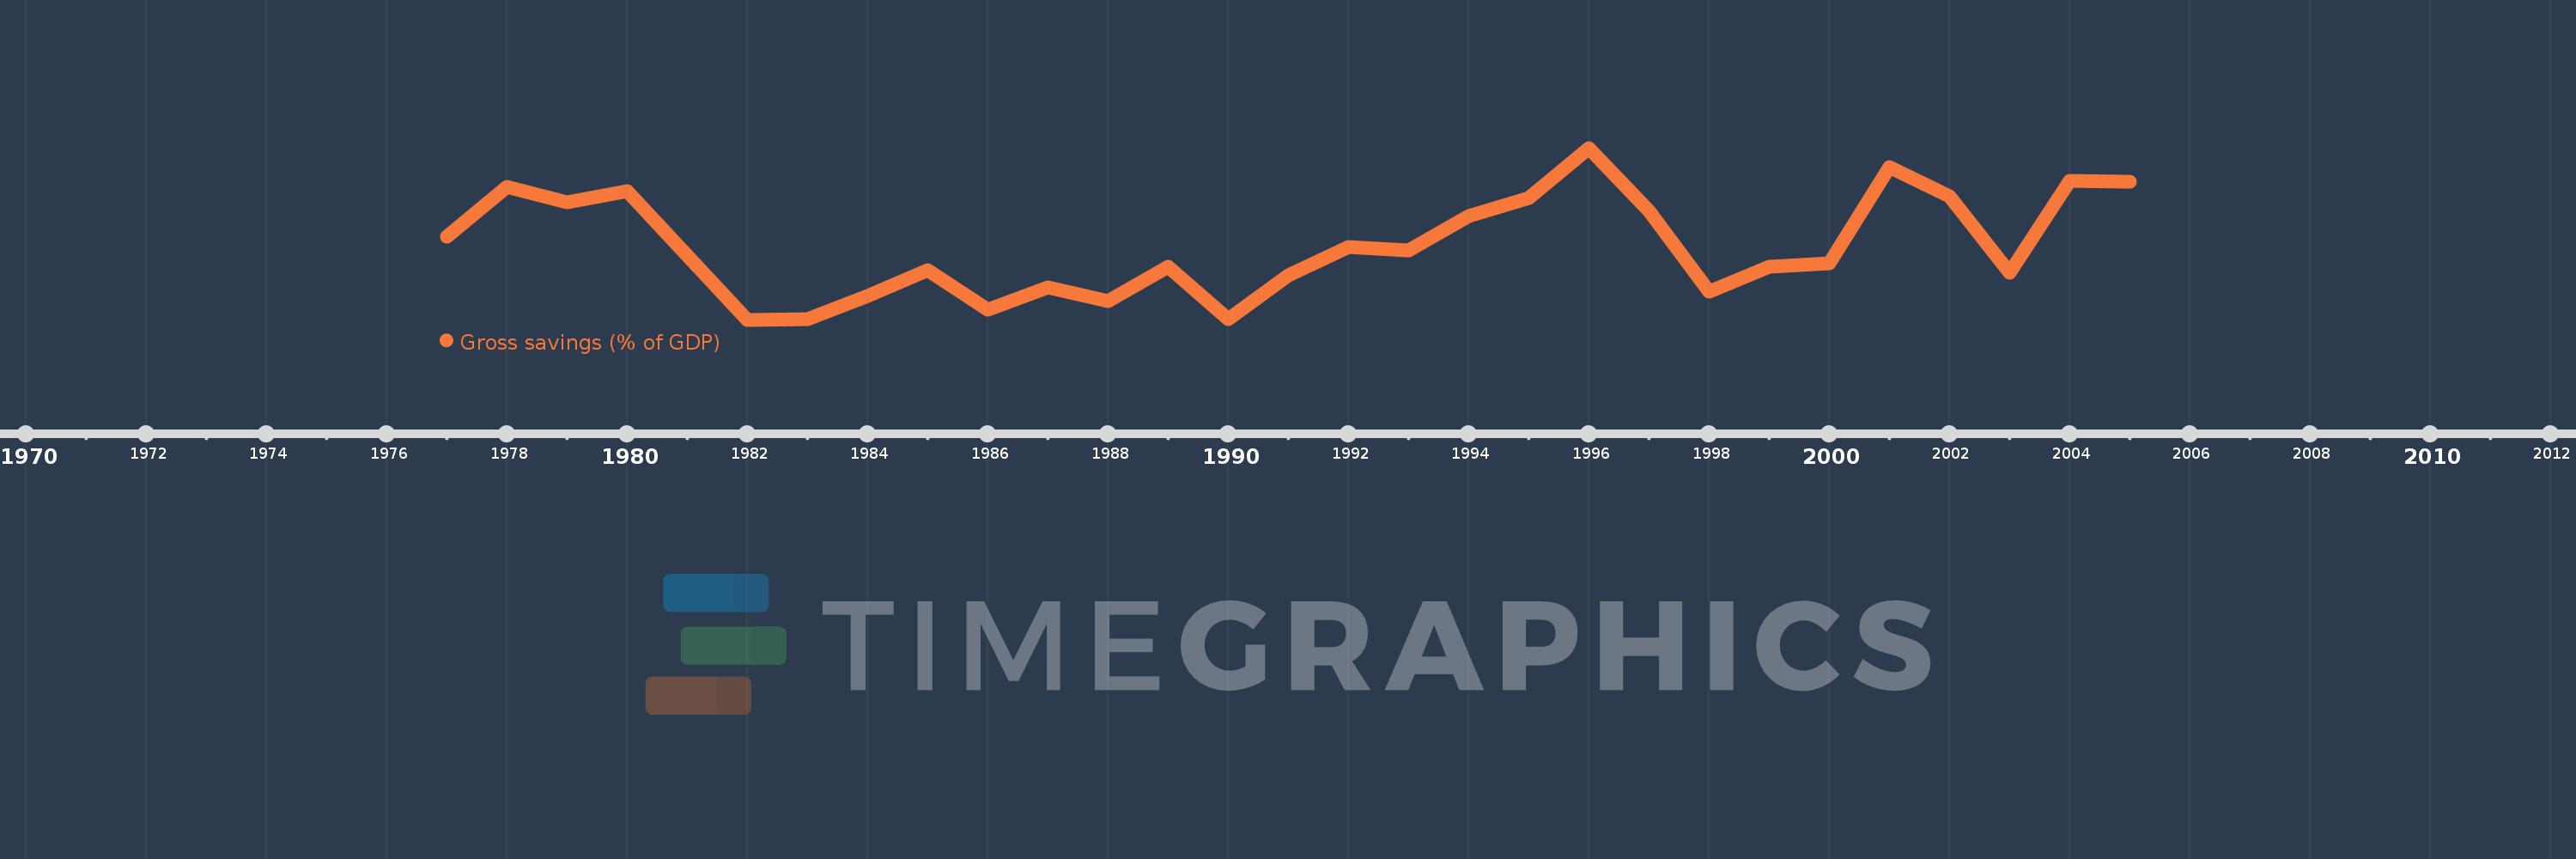
Gross savings (% of GDP)
2005,2004,2003,2002,2001,2000,1999,1998,1997,1996,1995,1994,1993,1992,1991,1990,1989,1988,1987,1986,1985,1984,1983,1982,1981,1980,1979,1978,1977
This statistics in other country:
AfghanistanAlbaniaAlgeriaAngolaAntigua and BarbudaArab WorldArgentinaArmeniaAustraliaAustriaAzerbaijanBahamas, TheBahrainBangladeshBarbadosBelarusBelgiumBelizeBeninBermudaBhutanBoliviaBosnia and HerzegovinaBotswanaBrazilBrunei DarussalamBulgariaBurkina FasoBurundiCabo VerdeCambodiaCameroonCanadaCaribbean small statesCentral African RepublicCentral Europe and the BalticsChadChileChinaColombiaComorosCongo, Dem. Rep.Congo, Rep.Costa RicaCote d'IvoireCroatiaCyprusCzech RepublicDenmarkDjiboutiDominicaDominican RepublicEarly-demographic dividendEast Asia & PacificEast Asia & Pacific (excluding high income)East Asia & Pacific (IDA & IBRD countries)EcuadorEgypt, Arab Rep.El SalvadorEquatorial GuineaEritreaEstoniaEthiopiaEuro areaEurope & Central AsiaEurope & Central Asia (excluding high income)Europe & Central Asia (IDA & IBRD countries)European UnionFaroe IslandsFijiFinlandFragile and conflict affected situationsFranceGabonGambia, TheGeorgiaGermanyGhanaGreeceGrenadaGuatemalaGuineaGuinea-BissauGuyanaHaitiHeavily indebted poor countries (HIPC)High incomeHondurasHong Kong SAR, ChinaHungaryIBRD onlyIcelandIDA & IBRD totalIDA blendIDA onlyIDA totalIndiaIndonesiaIran, Islamic Rep.IraqIrelandIsraelItalyJamaicaJapanJordanKazakhstanKenyaKiribatiKorea, Rep.KosovoKuwaitKyrgyz RepublicLao PDRLate-demographic dividendLatin America & Caribbean Latin America & Caribbean (excluding high income)Latin America & the Caribbean (IDA & IBRD countries)LatviaLeast developed countries: UN classificationLebanonLesothoLiberiaLibyaLithuaniaLow & middle incomeLow incomeLower middle incomeLuxembourgMacao SAR, ChinaMacedonia, FYRMadagascarMalawiMalaysiaMaldivesMaliMaltaMauritaniaMauritiusMexicoMiddle East & North AfricaMiddle East & North Africa (excluding high income)Middle East & North Africa (IDA & IBRD countries)Middle incomeMoldovaMongoliaMontenegroMoroccoMozambiqueNamibiaNepalNetherlandsNew ZealandNicaraguaNigerNigeriaNorth AmericaNorwayOECD membersOmanOther small statesPacific island small statesPakistanPanamaPapua New GuineaParaguayPeruPhilippinesPolandPortugalPost-demographic dividendPre-demographic dividendQatarRomaniaRussian FederationRwandaSaudi ArabiaSenegalSerbiaSeychellesSierra LeoneSingaporeSlovak RepublicSloveniaSmall statesSolomon IslandsSouth AfricaSouth AsiaSouth Asia (IDA & IBRD)South SudanSpainSri LankaSt. Kitts and NevisSt. LuciaSt. Vincent and the GrenadinesSub-Saharan Africa Sub-Saharan Africa (excluding high income)Sub-Saharan Africa (IDA & IBRD countries)SudanSurinameSwazilandSwedenSwitzerlandSyrian Arab RepublicTajikistanTanzaniaThailandTimor-LesteTogoTongaTrinidad and TobagoTunisiaTurkeyUgandaUkraineUnited KingdomUnited StatesUpper middle incomeUruguayVanuatuVenezuela, RBVietnamWest Bank and GazaWorldYemen, Rep.ZambiaZimbabwe Timeline:
This timeline shows a graph from 1977 to 2005 of Papua New Guinea. No data until 1976. Number of actual observations by date: 29.
Source name:
World Development Indicators
Source organization:
World Bank national accounts data, and OECD National Accounts data files.
Categories, topics:
Economy & Growth
Last updated:
apr 23, 2017
Indicators value changes by year
Minimum:
10.901
jan 1, 1982
Maximum:
35.149
jan 1, 1996
At the date of observation
Value
Absolute change
Change from previous value
jan 1, 1977
22.665
+22.665
0.0%
jan 1, 1978
29.692
+7.027
31.0%
jan 1, 1979
27.454
-2.238
-7.54%
jan 1, 1980
29.094
+1.64
5.97%
jan 1, 1981
19.939
-9.155
-31.47%
jan 1, 1982
10.901
-9.038
-45.33%
jan 1, 1983
10.96
+0.059
0.54%
jan 1, 1984
14.293
+3.333
30.41%
jan 1, 1985
17.884
+3.591
25.12%
jan 1, 1986
12.344
-5.54
-30.98%
jan 1, 1987
15.426
+3.082
24.96%
jan 1, 1988
13.549
-1.876
-12.16%
jan 1, 1989
18.327
+4.778
35.26%
jan 1, 1990
10.99
-7.337
-40.03%
jan 1, 1991
17.12
+6.129
55.77%
jan 1, 1992
21.122
+4.003
23.38%
jan 1, 1993
20.74
-0.383
-1.81%
jan 1, 1994
25.476
+4.736
22.84%
jan 1, 1995
28.065
+2.589
10.16%
jan 1, 1996
35.149
+7.083
25.24%
jan 1, 1997
26.209
-8.94
-25.43%
jan 1, 1998
14.833
-11.376
-43.41%
jan 1, 1999
18.408
+3.576
24.11%
jan 1, 2000
18.879
+0.471
2.56%
jan 1, 2001
32.48
+13.601
72.04%
jan 1, 2002
28.349
-4.131
-12.72%
jan 1, 2003
17.479
-10.869
-38.34%
jan 1, 2004
30.53
+13.051
74.67%
jan 1, 2005
30.42
-0.11
-0.36%
Ranking of countries by current statistics by years


Comments: