29
/
en
AIzaSyAYiBZKx7MnpbEhh9jyipgxe19OcubqV5w
April 1, 2024
40757
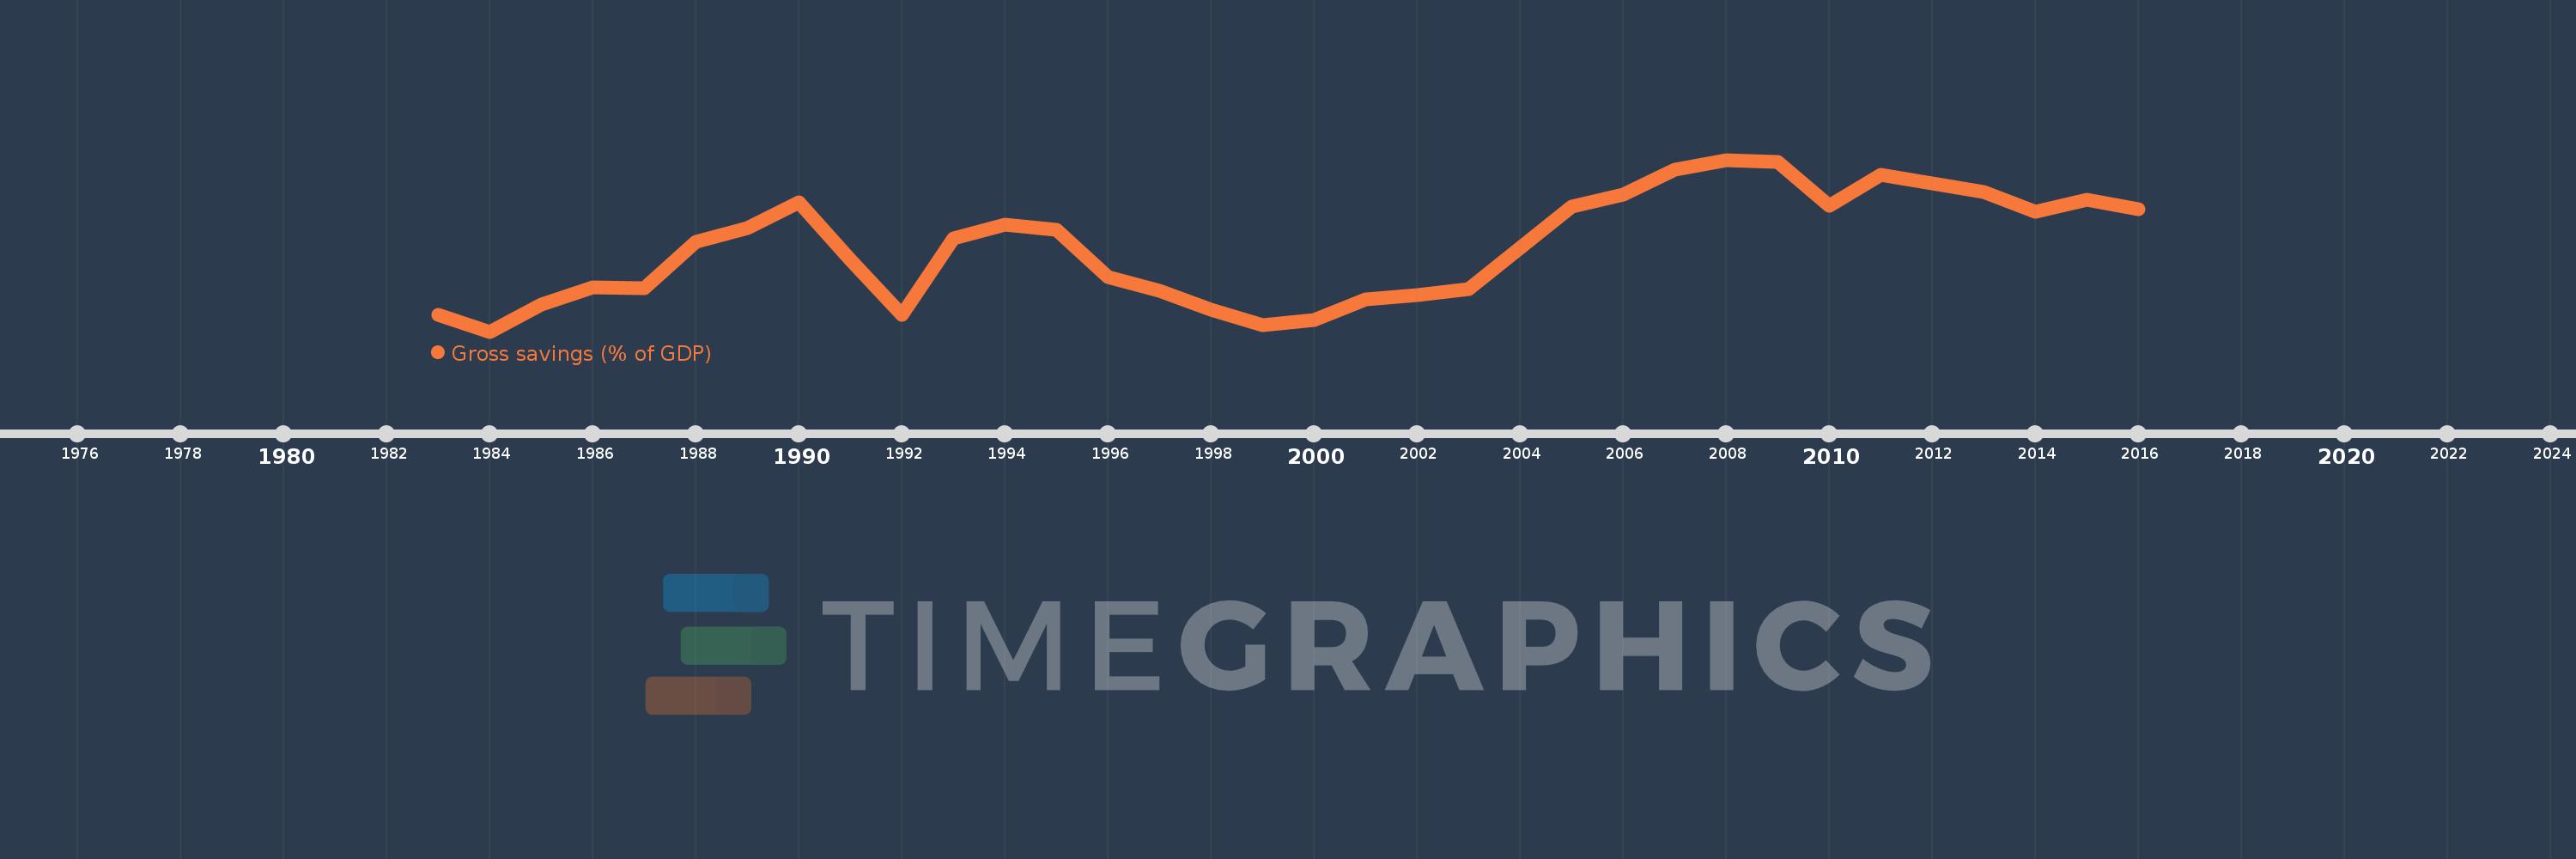
Late-demographic dividend
LTE
false
2
1
Gross savings (% of GDP)
2016,2015,2014,2013,2012,2011,2010,2009,2008,2007,2006,2005,2004,2003,2002,2001,2000,1999,1998,1997,1996,1995,1994,1993,1992,1991,1990,1989,1988,1987,1986,1985,1984,1983
This statistics in other country:
AfghanistanAlbaniaAlgeriaAngolaAntigua and BarbudaArab WorldArgentinaArmeniaAustraliaAustriaAzerbaijanBahamas, TheBahrainBangladeshBarbadosBelarusBelgiumBelizeBeninBermudaBhutanBoliviaBosnia and HerzegovinaBotswanaBrazilBrunei DarussalamBulgariaBurkina FasoBurundiCabo VerdeCambodiaCameroonCanadaCaribbean small statesCentral African RepublicCentral Europe and the BalticsChadChileChinaColombiaComorosCongo, Dem. Rep.Congo, Rep.Costa RicaCote d'IvoireCroatiaCyprusCzech RepublicDenmarkDjiboutiDominicaDominican RepublicEarly-demographic dividendEast Asia & PacificEast Asia & Pacific (excluding high income)East Asia & Pacific (IDA & IBRD countries)EcuadorEgypt, Arab Rep.El SalvadorEquatorial GuineaEritreaEstoniaEthiopiaEuro areaEurope & Central AsiaEurope & Central Asia (excluding high income)Europe & Central Asia (IDA & IBRD countries)European UnionFaroe IslandsFijiFinlandFragile and conflict affected situationsFranceGabonGambia, TheGeorgiaGermanyGhanaGreeceGrenadaGuatemalaGuineaGuinea-BissauGuyanaHaitiHeavily indebted poor countries (HIPC)High incomeHondurasHong Kong SAR, ChinaHungaryIBRD onlyIcelandIDA & IBRD totalIDA blendIDA onlyIDA totalIndiaIndonesiaIran, Islamic Rep.IraqIrelandIsraelItalyJamaicaJapanJordanKazakhstanKenyaKiribatiKorea, Rep.KosovoKuwaitKyrgyz RepublicLao PDRLate-demographic dividendLatin America & Caribbean Latin America & Caribbean (excluding high income)Latin America & the Caribbean (IDA & IBRD countries)LatviaLeast developed countries: UN classificationLebanonLesothoLiberiaLibyaLithuaniaLow & middle incomeLow incomeLower middle incomeLuxembourgMacao SAR, ChinaMacedonia, FYRMadagascarMalawiMalaysiaMaldivesMaliMaltaMauritaniaMauritiusMexicoMiddle East & North AfricaMiddle East & North Africa (excluding high income)Middle East & North Africa (IDA & IBRD countries)Middle incomeMoldovaMongoliaMontenegroMoroccoMozambiqueNamibiaNepalNetherlandsNew ZealandNicaraguaNigerNigeriaNorth AmericaNorwayOECD membersOmanOther small statesPacific island small statesPakistanPanamaPapua New GuineaParaguayPeruPhilippinesPolandPortugalPost-demographic dividendPre-demographic dividendQatarRomaniaRussian FederationRwandaSaudi ArabiaSenegalSerbiaSeychellesSierra LeoneSingaporeSlovak RepublicSloveniaSmall statesSolomon IslandsSouth AfricaSouth AsiaSouth Asia (IDA & IBRD)South SudanSpainSri LankaSt. Kitts and NevisSt. LuciaSt. Vincent and the GrenadinesSub-Saharan Africa Sub-Saharan Africa (excluding high income)Sub-Saharan Africa (IDA & IBRD countries)SudanSurinameSwazilandSwedenSwitzerlandSyrian Arab RepublicTajikistanTanzaniaThailandTimor-LesteTogoTongaTrinidad and TobagoTunisiaTurkeyUgandaUkraineUnited KingdomUnited StatesUpper middle incomeUruguayVanuatuVenezuela, RBVietnamWest Bank and GazaWorldYemen, Rep.ZambiaZimbabwe Timeline:
This timeline shows a graph from 1983 to 2016 of Late-demographic dividend. No data until 1982. Number of actual observations by date: 34.
Source name:
World Development Indicators
Source organization:
World Bank national accounts data, and OECD National Accounts data files.
Categories, topics:
Economy & Growth
Last updated:
apr 23, 2017
Indicators value changes by year
Minimum:
27.832
jan 1, 1984
At the date of observation
Value
Absolute change
Change from previous value
jan 1, 1983
28.785
+28.785
0.0%
jan 1, 1984
27.832
-0.953
-3.31%
jan 1, 1985
29.401
+1.569
5.64%
jan 1, 1986
30.367
+0.966
3.29%
jan 1, 1987
30.314
-0.054
-0.18%
jan 1, 1988
33.007
+2.694
8.89%
jan 1, 1989
33.801
+0.793
2.4%
jan 1, 1990
35.282
+1.481
4.38%
jan 1, 1991
31.975
-3.307
-9.37%
jan 1, 1992
28.797
-3.178
-9.94%
jan 1, 1993
33.174
+4.378
15.2%
jan 1, 1994
33.972
+0.798
2.4%
jan 1, 1995
33.657
-0.315
-0.93%
jan 1, 1996
30.989
-2.668
-7.93%
jan 1, 1997
30.174
-0.815
-2.63%
jan 1, 1998
29.114
-1.06
-3.51%
jan 1, 1999
28.198
-0.915
-3.14%
jan 1, 2000
28.516
+0.318
1.13%
jan 1, 2001
29.665
+1.149
4.03%
jan 1, 2002
29.913
+0.248
0.84%
jan 1, 2003
30.263
+0.349
1.17%
jan 1, 2004
32.647
+2.384
7.88%
jan 1, 2005
35.034
+2.387
7.31%
jan 1, 2006
35.683
+0.649
1.85%
jan 1, 2007
37.149
+1.466
4.11%
jan 1, 2008
37.7
+0.551
1.48%
jan 1, 2009
37.597
-0.103
-0.27%
jan 1, 2010
35.06
-2.537
-6.75%
jan 1, 2011
36.825
+1.765
5.03%
jan 1, 2012
36.367
-0.458
-1.24%
jan 1, 2013
35.841
-0.526
-1.45%
jan 1, 2014
34.72
-1.121
-3.13%
jan 1, 2015
35.383
+0.663
1.91%
jan 1, 2016
34.861
-0.522
-1.47%
Ranking of countries by current statistics by years


Comments: