29
/
en
AIzaSyAYiBZKx7MnpbEhh9jyipgxe19OcubqV5w
April 1, 2024
24943
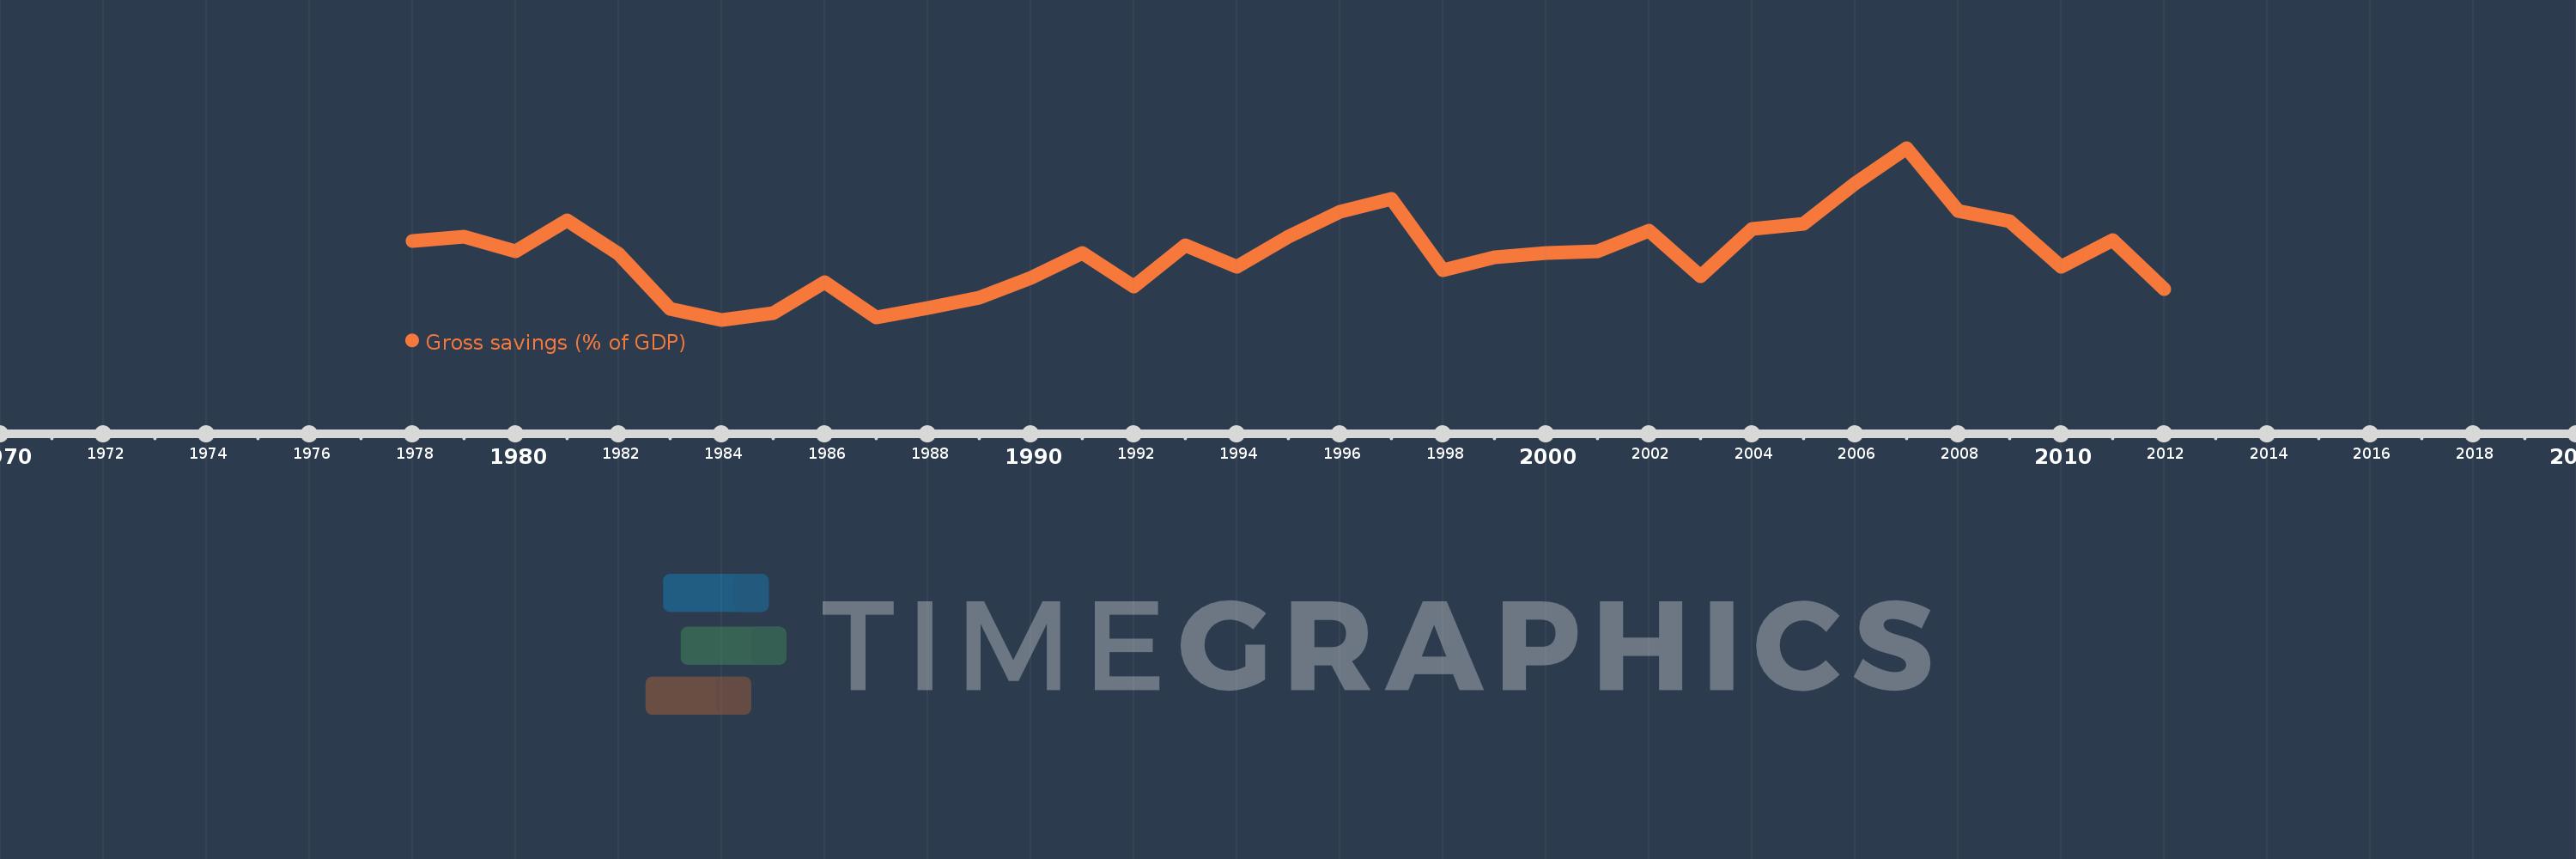
Caribbean small states
CSS
false
2
1
Gross savings (% of GDP)
2012,2011,2010,2009,2008,2007,2006,2005,2004,2003,2002,2001,2000,1999,1998,1997,1996,1995,1994,1993,1992,1991,1990,1989,1988,1987,1986,1985,1984,1983,1982,1981,1980,1979,1978
This statistics in other country:
AfghanistanAlbaniaAlgeriaAngolaAntigua and BarbudaArab WorldArgentinaArmeniaAustraliaAustriaAzerbaijanBahamas, TheBahrainBangladeshBarbadosBelarusBelgiumBelizeBeninBermudaBhutanBoliviaBosnia and HerzegovinaBotswanaBrazilBrunei DarussalamBulgariaBurkina FasoBurundiCabo VerdeCambodiaCameroonCanadaCaribbean small statesCentral African RepublicCentral Europe and the BalticsChadChileChinaColombiaComorosCongo, Dem. Rep.Congo, Rep.Costa RicaCote d'IvoireCroatiaCyprusCzech RepublicDenmarkDjiboutiDominicaDominican RepublicEarly-demographic dividendEast Asia & PacificEast Asia & Pacific (excluding high income)East Asia & Pacific (IDA & IBRD countries)EcuadorEgypt, Arab Rep.El SalvadorEquatorial GuineaEritreaEstoniaEthiopiaEuro areaEurope & Central AsiaEurope & Central Asia (excluding high income)Europe & Central Asia (IDA & IBRD countries)European UnionFaroe IslandsFijiFinlandFragile and conflict affected situationsFranceGabonGambia, TheGeorgiaGermanyGhanaGreeceGrenadaGuatemalaGuineaGuinea-BissauGuyanaHaitiHeavily indebted poor countries (HIPC)High incomeHondurasHong Kong SAR, ChinaHungaryIBRD onlyIcelandIDA & IBRD totalIDA blendIDA onlyIDA totalIndiaIndonesiaIran, Islamic Rep.IraqIrelandIsraelItalyJamaicaJapanJordanKazakhstanKenyaKiribatiKorea, Rep.KosovoKuwaitKyrgyz RepublicLao PDRLate-demographic dividendLatin America & Caribbean Latin America & Caribbean (excluding high income)Latin America & the Caribbean (IDA & IBRD countries)LatviaLeast developed countries: UN classificationLebanonLesothoLiberiaLibyaLithuaniaLow & middle incomeLow incomeLower middle incomeLuxembourgMacao SAR, ChinaMacedonia, FYRMadagascarMalawiMalaysiaMaldivesMaliMaltaMauritaniaMauritiusMexicoMiddle East & North AfricaMiddle East & North Africa (excluding high income)Middle East & North Africa (IDA & IBRD countries)Middle incomeMoldovaMongoliaMontenegroMoroccoMozambiqueNamibiaNepalNetherlandsNew ZealandNicaraguaNigerNigeriaNorth AmericaNorwayOECD membersOmanOther small statesPacific island small statesPakistanPanamaPapua New GuineaParaguayPeruPhilippinesPolandPortugalPost-demographic dividendPre-demographic dividendQatarRomaniaRussian FederationRwandaSaudi ArabiaSenegalSerbiaSeychellesSierra LeoneSingaporeSlovak RepublicSloveniaSmall statesSolomon IslandsSouth AfricaSouth AsiaSouth Asia (IDA & IBRD)South SudanSpainSri LankaSt. Kitts and NevisSt. LuciaSt. Vincent and the GrenadinesSub-Saharan Africa Sub-Saharan Africa (excluding high income)Sub-Saharan Africa (IDA & IBRD countries)SudanSurinameSwazilandSwedenSwitzerlandSyrian Arab RepublicTajikistanTanzaniaThailandTimor-LesteTogoTongaTrinidad and TobagoTunisiaTurkeyUgandaUkraineUnited KingdomUnited StatesUpper middle incomeUruguayVanuatuVenezuela, RBVietnamWest Bank and GazaWorldYemen, Rep.ZambiaZimbabwe Timeline:
This timeline shows a graph from 1978 to 2012 of Caribbean small states. No data until 1977. Number of actual observations by date: 35.
Source name:
World Development Indicators
Source organization:
World Bank national accounts data, and OECD National Accounts data files.
Categories, topics:
Economy & Growth
Last updated:
apr 23, 2017
Indicators value changes by year
Minimum:
14.462
jan 1, 1984
Maximum:
31.034
jan 1, 2007
At the date of observation
Value
Absolute change
Change from previous value
jan 1, 1978
22.048
+22.048
0.0%
jan 1, 1979
22.442
+0.395
1.79%
jan 1, 1980
21.101
-1.342
-5.98%
jan 1, 1981
24.063
+2.962
14.04%
jan 1, 1982
20.789
-3.274
-13.61%
jan 1, 1983
15.539
-5.25
-25.25%
jan 1, 1984
14.462
-1.078
-6.93%
jan 1, 1985
15.132
+0.67
4.64%
jan 1, 1986
18.06
+2.928
19.35%
jan 1, 1987
14.708
-3.352
-18.56%
jan 1, 1988
15.633
+0.925
6.29%
jan 1, 1989
16.573
+0.94
6.01%
jan 1, 1990
18.515
+1.942
11.72%
jan 1, 1991
20.887
+2.372
12.81%
jan 1, 1992
17.649
-3.238
-15.5%
jan 1, 1993
21.654
+4.006
22.7%
jan 1, 1994
19.577
-2.077
-9.59%
jan 1, 1995
22.484
+2.907
14.85%
jan 1, 1996
24.913
+2.429
10.8%
jan 1, 1997
26.084
+1.171
4.7%
jan 1, 1998
19.245
-6.839
-26.22%
jan 1, 1999
20.51
+1.265
6.57%
jan 1, 2000
20.936
+0.426
2.08%
jan 1, 2001
21.034
+0.098
0.47%
jan 1, 2002
23.094
+2.06
9.79%
jan 1, 2003
18.702
-4.392
-19.02%
jan 1, 2004
23.19
+4.489
24.0%
jan 1, 2005
23.686
+0.496
2.14%
jan 1, 2006
27.601
+3.915
16.53%
jan 1, 2007
31.034
+3.433
12.44%
jan 1, 2008
24.991
-6.043
-19.47%
jan 1, 2009
23.935
-1.056
-4.23%
jan 1, 2010
19.578
-4.357
-18.2%
jan 1, 2011
22.102
+2.524
12.89%
jan 1, 2012
17.434
-4.668
-21.12%
Ranking of countries by current statistics by years


Comments: