29
/
en
AIzaSyAYiBZKx7MnpbEhh9jyipgxe19OcubqV5w
April 1, 2024
91221
Brazil
BRA
true
2
1
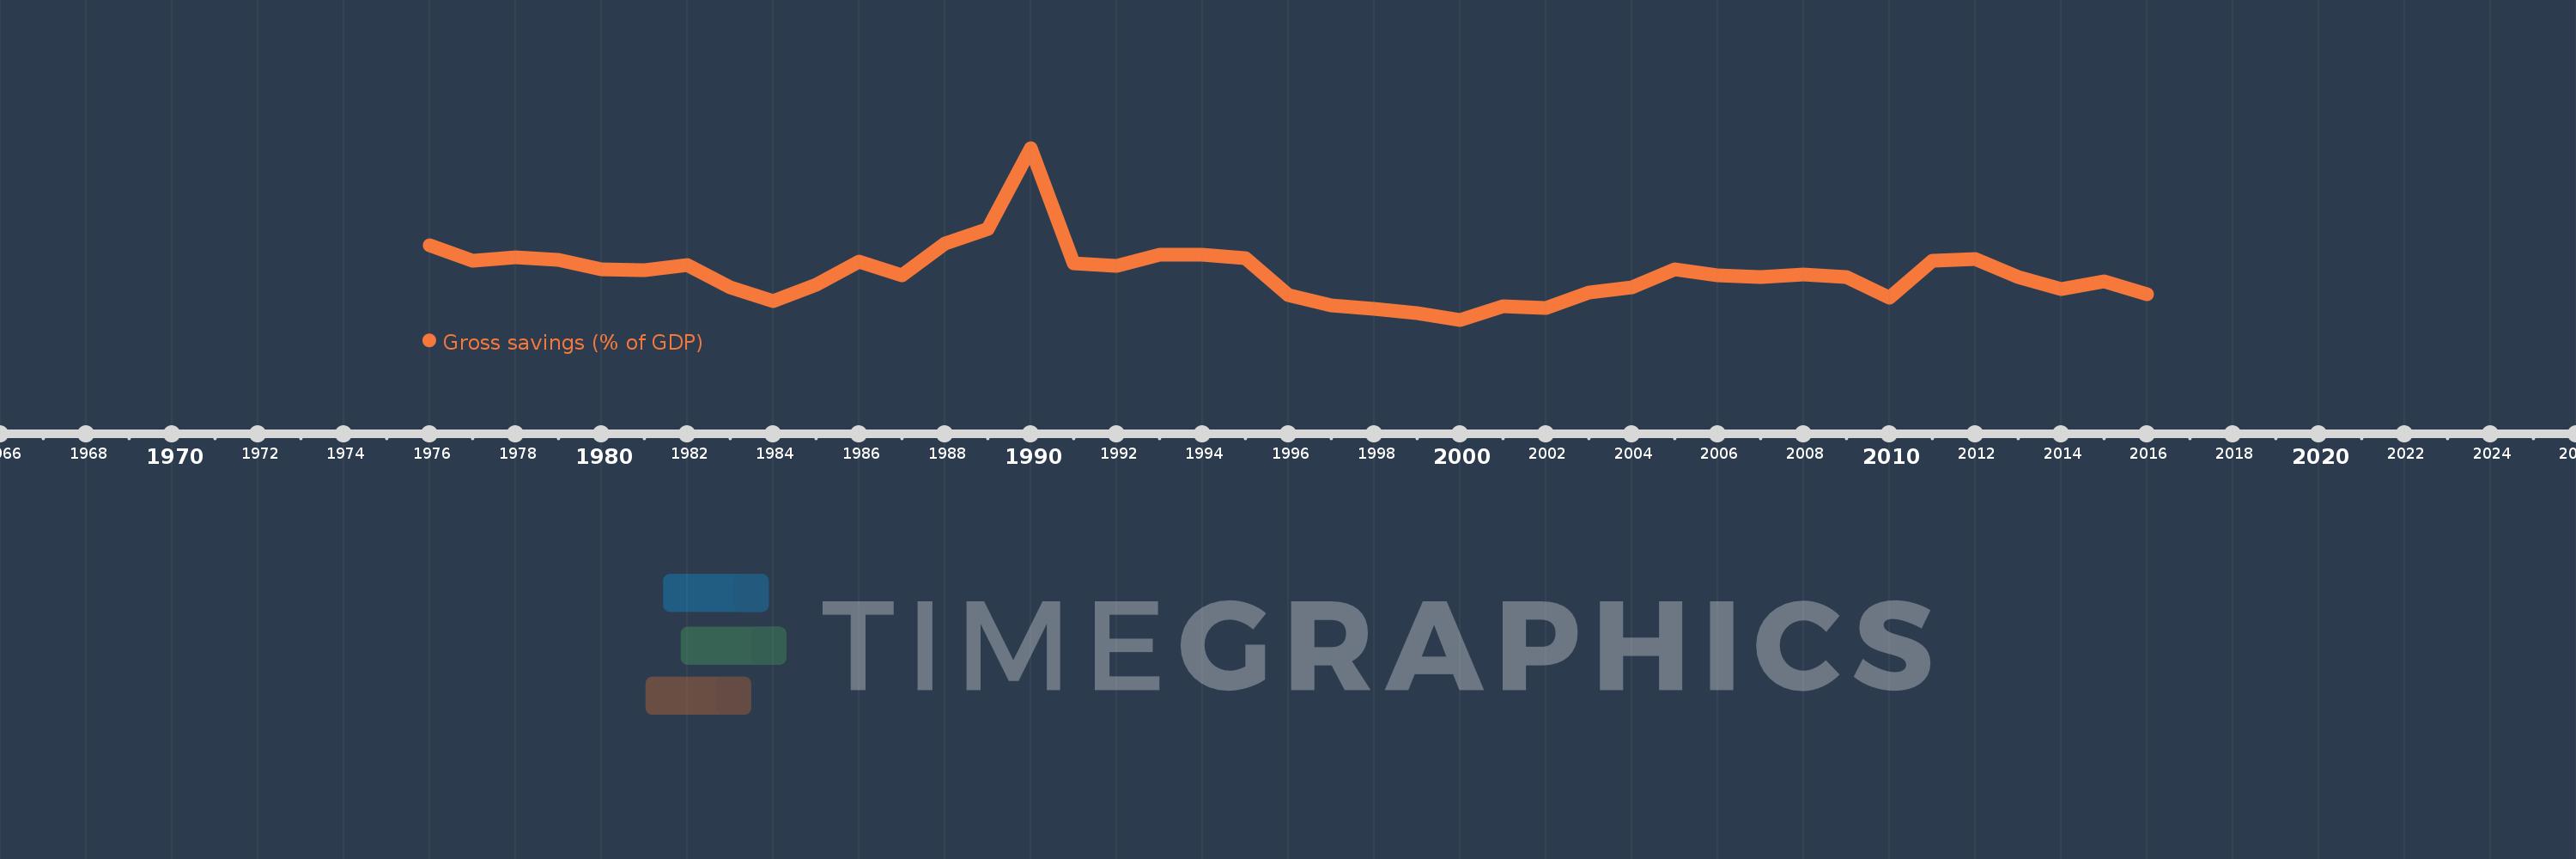
Gross savings (% of GDP)
2016,2015,2014,2013,2012,2011,2010,2009,2008,2007,2006,2005,2004,2003,2002,2001,2000,1999,1998,1997,1996,1995,1994,1993,1992,1991,1990,1989,1988,1987,1986,1985,1984,1983,1982,1981,1980,1979,1978,1977,1976
This statistics in other country:
AfghanistanAlbaniaAlgeriaAngolaAntigua and BarbudaArab WorldArgentinaArmeniaAustraliaAustriaAzerbaijanBahamas, TheBahrainBangladeshBarbadosBelarusBelgiumBelizeBeninBermudaBhutanBoliviaBosnia and HerzegovinaBotswanaBrazilBrunei DarussalamBulgariaBurkina FasoBurundiCabo VerdeCambodiaCameroonCanadaCaribbean small statesCentral African RepublicCentral Europe and the BalticsChadChileChinaColombiaComorosCongo, Dem. Rep.Congo, Rep.Costa RicaCote d'IvoireCroatiaCyprusCzech RepublicDenmarkDjiboutiDominicaDominican RepublicEarly-demographic dividendEast Asia & PacificEast Asia & Pacific (excluding high income)East Asia & Pacific (IDA & IBRD countries)EcuadorEgypt, Arab Rep.El SalvadorEquatorial GuineaEritreaEstoniaEthiopiaEuro areaEurope & Central AsiaEurope & Central Asia (excluding high income)Europe & Central Asia (IDA & IBRD countries)European UnionFaroe IslandsFijiFinlandFragile and conflict affected situationsFranceGabonGambia, TheGeorgiaGermanyGhanaGreeceGrenadaGuatemalaGuineaGuinea-BissauGuyanaHaitiHeavily indebted poor countries (HIPC)High incomeHondurasHong Kong SAR, ChinaHungaryIBRD onlyIcelandIDA & IBRD totalIDA blendIDA onlyIDA totalIndiaIndonesiaIran, Islamic Rep.IraqIrelandIsraelItalyJamaicaJapanJordanKazakhstanKenyaKiribatiKorea, Rep.KosovoKuwaitKyrgyz RepublicLao PDRLate-demographic dividendLatin America & Caribbean Latin America & Caribbean (excluding high income)Latin America & the Caribbean (IDA & IBRD countries)LatviaLeast developed countries: UN classificationLebanonLesothoLiberiaLibyaLithuaniaLow & middle incomeLow incomeLower middle incomeLuxembourgMacao SAR, ChinaMacedonia, FYRMadagascarMalawiMalaysiaMaldivesMaliMaltaMauritaniaMauritiusMexicoMiddle East & North AfricaMiddle East & North Africa (excluding high income)Middle East & North Africa (IDA & IBRD countries)Middle incomeMoldovaMongoliaMontenegroMoroccoMozambiqueNamibiaNepalNetherlandsNew ZealandNicaraguaNigerNigeriaNorth AmericaNorwayOECD membersOmanOther small statesPacific island small statesPakistanPanamaPapua New GuineaParaguayPeruPhilippinesPolandPortugalPost-demographic dividendPre-demographic dividendQatarRomaniaRussian FederationRwandaSaudi ArabiaSenegalSerbiaSeychellesSierra LeoneSingaporeSlovak RepublicSloveniaSmall statesSolomon IslandsSouth AfricaSouth AsiaSouth Asia (IDA & IBRD)South SudanSpainSri LankaSt. Kitts and NevisSt. LuciaSt. Vincent and the GrenadinesSub-Saharan Africa Sub-Saharan Africa (excluding high income)Sub-Saharan Africa (IDA & IBRD countries)SudanSurinameSwazilandSwedenSwitzerlandSyrian Arab RepublicTajikistanTanzaniaThailandTimor-LesteTogoTongaTrinidad and TobagoTunisiaTurkeyUgandaUkraineUnited KingdomUnited StatesUpper middle incomeUruguayVanuatuVenezuela, RBVietnamWest Bank and GazaWorldYemen, Rep.ZambiaZimbabwe Timeline:
This timeline shows a graph from 1976 to 2016 of Brazil. No data until 1975. Number of actual observations by date: 41.
Source name:
World Development Indicators
Source organization:
World Bank national accounts data, and OECD National Accounts data files.
Categories, topics:
Economy & Growth
Last updated:
apr 23, 2017
Indicators value changes by year
Minimum:
10.595
jan 1, 2000
Maximum:
35.807
jan 1, 1990
At the date of observation
Value
Absolute change
Change from previous value
jan 1, 1976
21.504
+21.504
0.0%
jan 1, 1977
19.2
-2.304
-10.71%
jan 1, 1978
19.747
+0.548
2.85%
jan 1, 1979
19.434
-0.314
-1.59%
jan 1, 1980
18.035
-1.399
-7.2%
jan 1, 1981
17.807
-0.228
-1.27%
jan 1, 1982
18.569
+0.762
4.28%
jan 1, 1983
15.291
-3.278
-17.65%
jan 1, 1984
13.315
-1.976
-12.92%
jan 1, 1985
15.761
+2.446
18.37%
jan 1, 1986
19.093
+3.332
21.14%
jan 1, 1987
17.124
-1.969
-10.31%
jan 1, 1988
21.811
+4.687
27.37%
jan 1, 1989
23.941
+2.13
9.76%
jan 1, 1990
35.807
+11.866
49.57%
jan 1, 1991
18.92
-16.887
-47.16%
jan 1, 1992
18.542
-0.377
-1.99%
jan 1, 1993
20.078
+1.536
8.28%
jan 1, 1994
20.185
+0.107
0.54%
jan 1, 1995
19.664
-0.522
-2.58%
jan 1, 1996
14.214
-5.449
-27.71%
jan 1, 1997
12.685
-1.529
-10.76%
jan 1, 1998
12.17
-0.515
-4.06%
jan 1, 1999
11.532
-0.638
-5.24%
jan 1, 2000
10.595
-0.937
-8.13%
jan 1, 2001
12.518
+1.923
18.15%
jan 1, 2002
12.348
-0.17
-1.36%
jan 1, 2003
14.537
+2.189
17.73%
jan 1, 2004
15.334
+0.796
5.48%
jan 1, 2005
17.997
+2.663
17.37%
jan 1, 2006
17.092
-0.905
-5.03%
jan 1, 2007
16.822
-0.27
-1.58%
jan 1, 2008
17.29
+0.468
2.78%
jan 1, 2009
16.876
-0.414
-2.39%
jan 1, 2010
13.861
-3.014
-17.86%
jan 1, 2011
19.257
+5.396
38.93%
jan 1, 2012
19.492
+0.235
1.22%
jan 1, 2013
16.91
-2.582
-13.25%
jan 1, 2014
15.122
-1.788
-10.57%
jan 1, 2015
16.233
+1.112
7.35%
jan 1, 2016
14.4
-1.833
-11.29%
Ranking of countries by current statistics by years


Comments: