29
/
en
AIzaSyAYiBZKx7MnpbEhh9jyipgxe19OcubqV5w
April 1, 2024
201645
Morocco
MAR
true
2
1
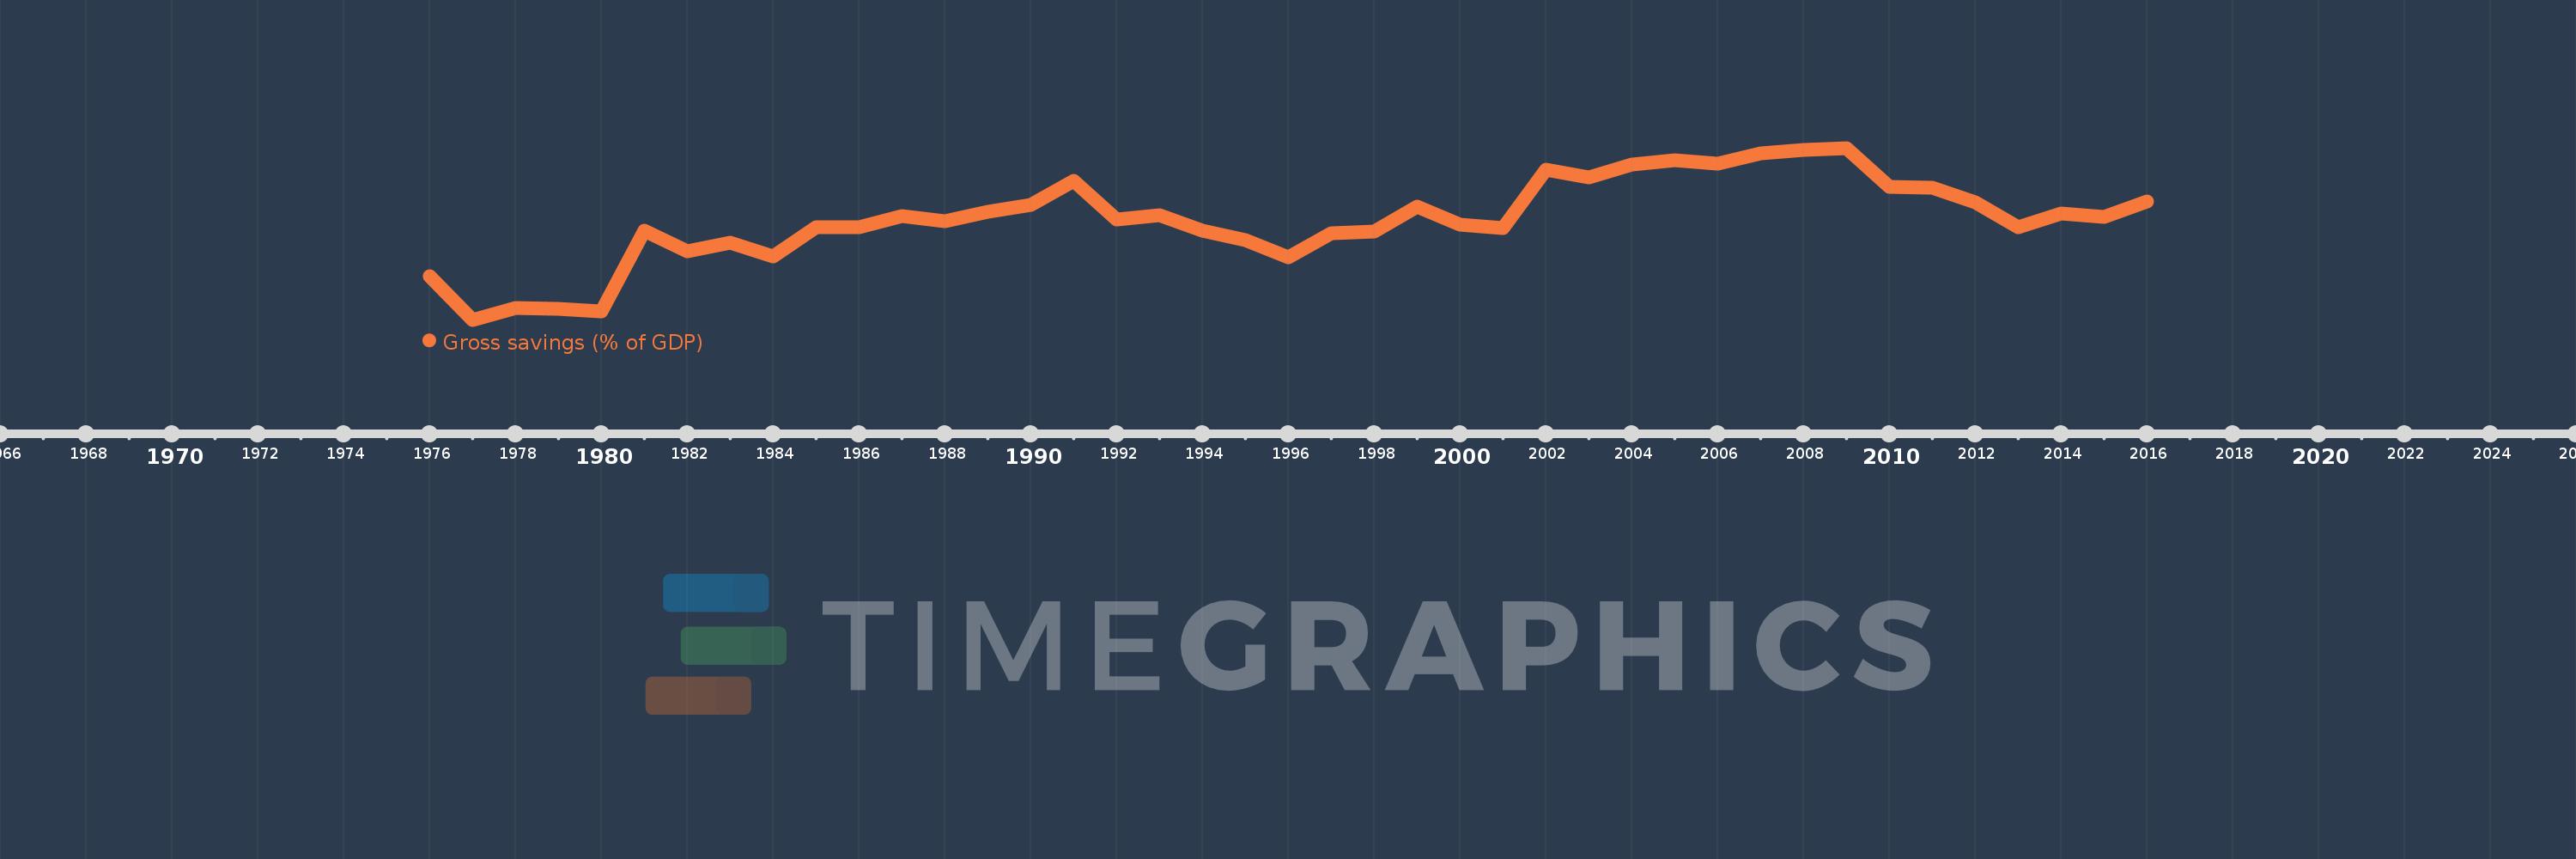
Gross savings (% of GDP)
2016,2015,2014,2013,2012,2011,2010,2009,2008,2007,2006,2005,2004,2003,2002,2001,2000,1999,1998,1997,1996,1995,1994,1993,1992,1991,1990,1989,1988,1987,1986,1985,1984,1983,1982,1981,1980,1979,1978,1977,1976
This statistics in other country:
AfghanistanAlbaniaAlgeriaAngolaAntigua and BarbudaArab WorldArgentinaArmeniaAustraliaAustriaAzerbaijanBahamas, TheBahrainBangladeshBarbadosBelarusBelgiumBelizeBeninBermudaBhutanBoliviaBosnia and HerzegovinaBotswanaBrazilBrunei DarussalamBulgariaBurkina FasoBurundiCabo VerdeCambodiaCameroonCanadaCaribbean small statesCentral African RepublicCentral Europe and the BalticsChadChileChinaColombiaComorosCongo, Dem. Rep.Congo, Rep.Costa RicaCote d'IvoireCroatiaCyprusCzech RepublicDenmarkDjiboutiDominicaDominican RepublicEarly-demographic dividendEast Asia & PacificEast Asia & Pacific (excluding high income)East Asia & Pacific (IDA & IBRD countries)EcuadorEgypt, Arab Rep.El SalvadorEquatorial GuineaEritreaEstoniaEthiopiaEuro areaEurope & Central AsiaEurope & Central Asia (excluding high income)Europe & Central Asia (IDA & IBRD countries)European UnionFaroe IslandsFijiFinlandFragile and conflict affected situationsFranceGabonGambia, TheGeorgiaGermanyGhanaGreeceGrenadaGuatemalaGuineaGuinea-BissauGuyanaHaitiHeavily indebted poor countries (HIPC)High incomeHondurasHong Kong SAR, ChinaHungaryIBRD onlyIcelandIDA & IBRD totalIDA blendIDA onlyIDA totalIndiaIndonesiaIran, Islamic Rep.IraqIrelandIsraelItalyJamaicaJapanJordanKazakhstanKenyaKiribatiKorea, Rep.KosovoKuwaitKyrgyz RepublicLao PDRLate-demographic dividendLatin America & Caribbean Latin America & Caribbean (excluding high income)Latin America & the Caribbean (IDA & IBRD countries)LatviaLeast developed countries: UN classificationLebanonLesothoLiberiaLibyaLithuaniaLow & middle incomeLow incomeLower middle incomeLuxembourgMacao SAR, ChinaMacedonia, FYRMadagascarMalawiMalaysiaMaldivesMaliMaltaMauritaniaMauritiusMexicoMiddle East & North AfricaMiddle East & North Africa (excluding high income)Middle East & North Africa (IDA & IBRD countries)Middle incomeMoldovaMongoliaMontenegroMoroccoMozambiqueNamibiaNepalNetherlandsNew ZealandNicaraguaNigerNigeriaNorth AmericaNorwayOECD membersOmanOther small statesPacific island small statesPakistanPanamaPapua New GuineaParaguayPeruPhilippinesPolandPortugalPost-demographic dividendPre-demographic dividendQatarRomaniaRussian FederationRwandaSaudi ArabiaSenegalSerbiaSeychellesSierra LeoneSingaporeSlovak RepublicSloveniaSmall statesSolomon IslandsSouth AfricaSouth AsiaSouth Asia (IDA & IBRD)South SudanSpainSri LankaSt. Kitts and NevisSt. LuciaSt. Vincent and the GrenadinesSub-Saharan Africa Sub-Saharan Africa (excluding high income)Sub-Saharan Africa (IDA & IBRD countries)SudanSurinameSwazilandSwedenSwitzerlandSyrian Arab RepublicTajikistanTanzaniaThailandTimor-LesteTogoTongaTrinidad and TobagoTunisiaTurkeyUgandaUkraineUnited KingdomUnited StatesUpper middle incomeUruguayVanuatuVenezuela, RBVietnamWest Bank and GazaWorldYemen, Rep.ZambiaZimbabwe Timeline:
This timeline shows a graph from 1976 to 2016 of Morocco. No data until 1975. Number of actual observations by date: 41.
Source name:
World Development Indicators
Source organization:
World Bank national accounts data, and OECD National Accounts data files.
Categories, topics:
Economy & Growth
Last updated:
apr 23, 2017
Indicators value changes by year
Minimum:
14.833
jan 1, 1977
Maximum:
34.167
jan 1, 2009
At the date of observation
Value
Absolute change
Change from previous value
jan 1, 1976
19.752
+19.752
0.0%
jan 1, 1977
14.833
-4.92
-24.91%
jan 1, 1978
16.205
+1.373
9.25%
jan 1, 1979
16.029
-0.177
-1.09%
jan 1, 1980
15.789
-0.24
-1.5%
jan 1, 1981
24.819
+9.03
57.19%
jan 1, 1982
22.575
-2.243
-9.04%
jan 1, 1983
23.487
+0.911
4.04%
jan 1, 1984
21.911
-1.576
-6.71%
jan 1, 1985
25.282
+3.371
15.38%
jan 1, 1986
25.262
-0.02
-0.08%
jan 1, 1987
26.511
+1.249
4.94%
jan 1, 1988
25.926
-0.584
-2.2%
jan 1, 1989
26.986
+1.06
4.09%
jan 1, 1990
27.74
+0.753
2.79%
jan 1, 1991
30.44
+2.7
9.73%
jan 1, 1992
26.16
-4.28
-14.06%
jan 1, 1993
26.571
+0.411
1.57%
jan 1, 1994
24.881
-1.69
-6.36%
jan 1, 1995
23.763
-1.118
-4.49%
jan 1, 1996
21.845
-1.918
-8.07%
jan 1, 1997
24.587
+2.742
12.55%
jan 1, 1998
24.762
+0.175
0.71%
jan 1, 1999
27.517
+2.755
11.13%
jan 1, 2000
25.505
-2.012
-7.31%
jan 1, 2001
25.193
-0.313
-1.23%
jan 1, 2002
31.767
+6.575
26.1%
jan 1, 2003
30.855
-0.912
-2.87%
jan 1, 2004
32.265
+1.41
4.57%
jan 1, 2005
32.758
+0.493
1.53%
jan 1, 2006
32.386
-0.372
-1.14%
jan 1, 2007
33.585
+1.199
3.7%
jan 1, 2008
33.929
+0.345
1.03%
jan 1, 2009
34.167
+0.238
0.7%
jan 1, 2010
29.778
-4.389
-12.85%
jan 1, 2011
29.715
-0.064
-0.21%
jan 1, 2012
28.069
-1.646
-5.54%
jan 1, 2013
25.251
-2.817
-10.04%
jan 1, 2014
26.782
+1.531
6.06%
jan 1, 2015
26.357
-0.425
-1.59%
jan 1, 2016
28.18
+1.823
6.92%
Ranking of countries by current statistics by years


Comments: