29
/
en
AIzaSyAYiBZKx7MnpbEhh9jyipgxe19OcubqV5w
April 1, 2024
41505
Latin America & Caribbean
LCN
false
2
1
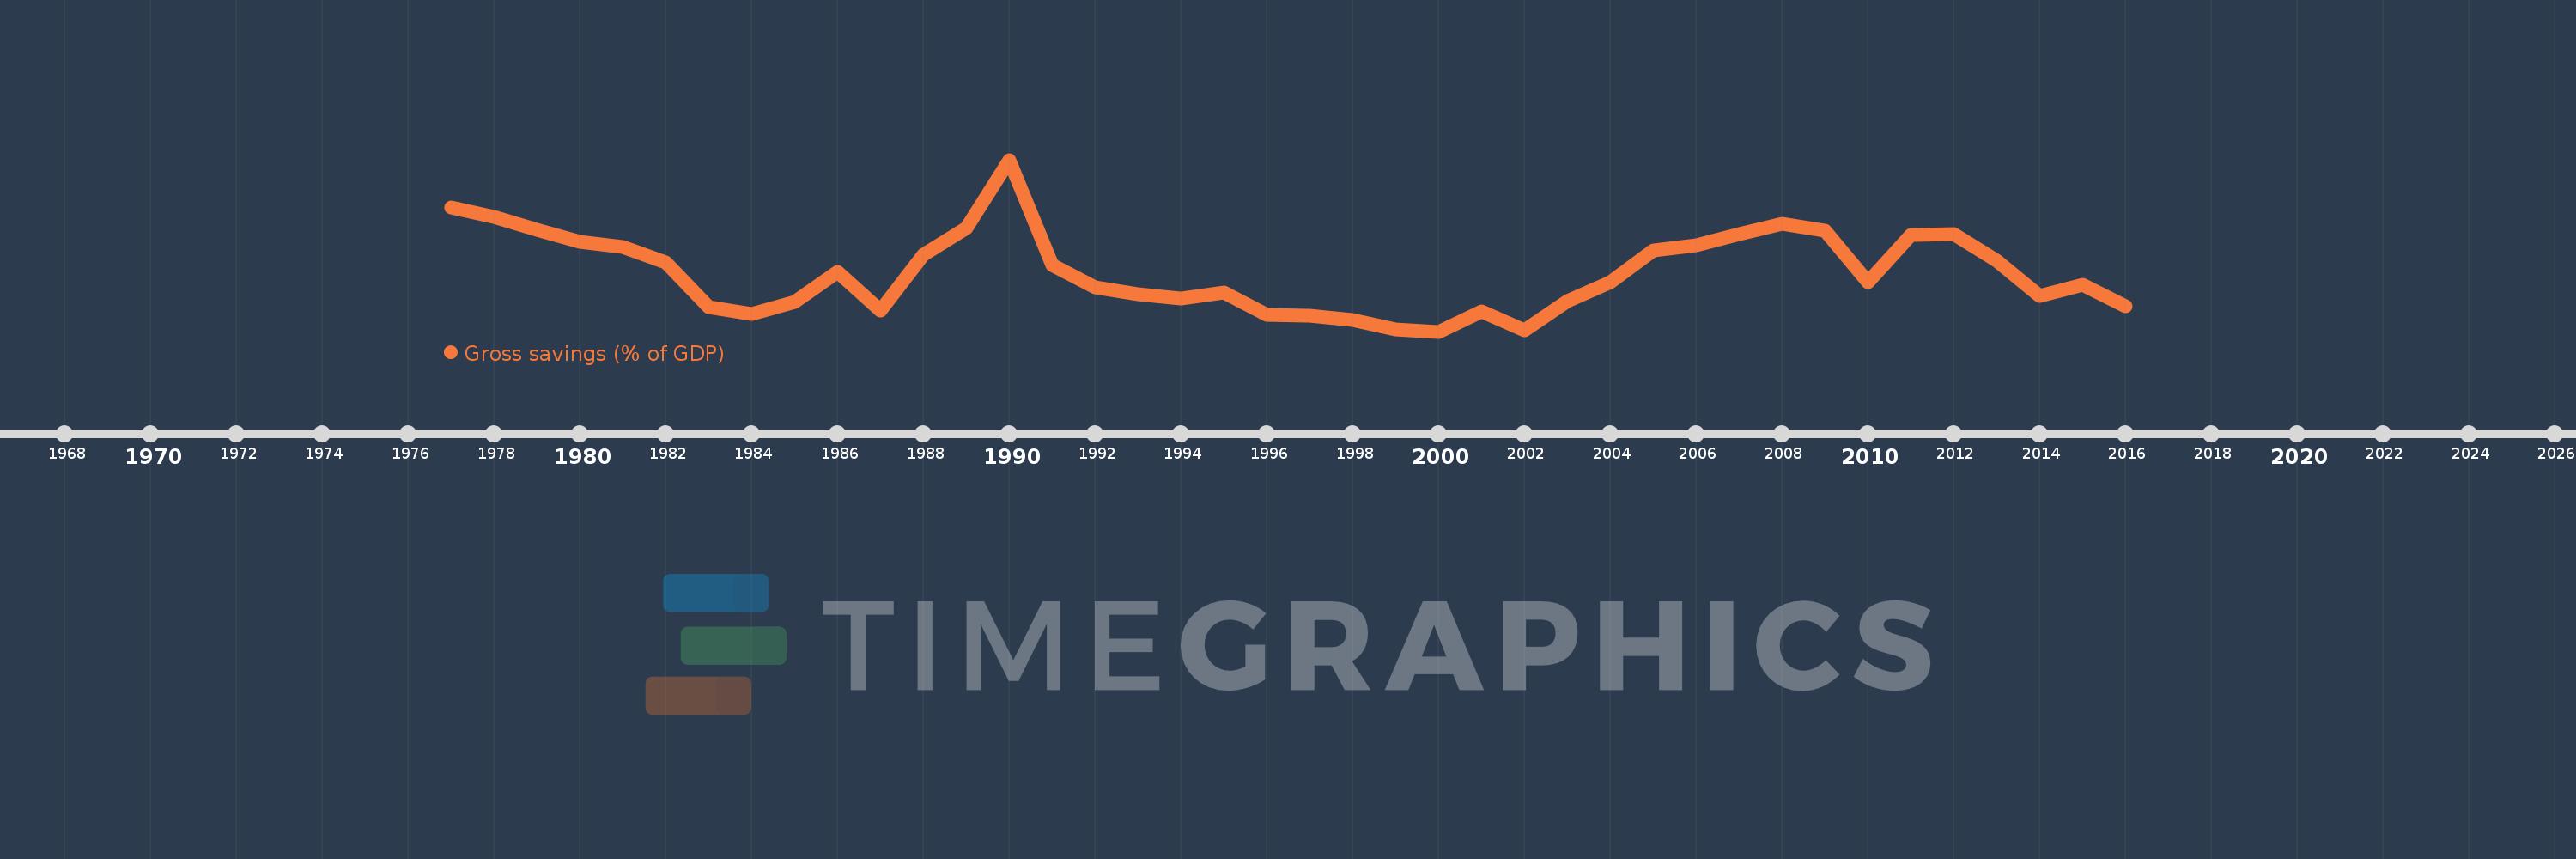
Gross savings (% of GDP)
2016,2015,2014,2013,2012,2011,2010,2009,2008,2007,2006,2005,2004,2003,2002,2001,2000,1999,1998,1997,1996,1995,1994,1993,1992,1991,1990,1989,1988,1987,1986,1985,1984,1983,1982,1981,1980,1979,1978,1977
This statistics in other country:
AfghanistanAlbaniaAlgeriaAngolaAntigua and BarbudaArab WorldArgentinaArmeniaAustraliaAustriaAzerbaijanBahamas, TheBahrainBangladeshBarbadosBelarusBelgiumBelizeBeninBermudaBhutanBoliviaBosnia and HerzegovinaBotswanaBrazilBrunei DarussalamBulgariaBurkina FasoBurundiCabo VerdeCambodiaCameroonCanadaCaribbean small statesCentral African RepublicCentral Europe and the BalticsChadChileChinaColombiaComorosCongo, Dem. Rep.Congo, Rep.Costa RicaCote d'IvoireCroatiaCyprusCzech RepublicDenmarkDjiboutiDominicaDominican RepublicEarly-demographic dividendEast Asia & PacificEast Asia & Pacific (excluding high income)East Asia & Pacific (IDA & IBRD countries)EcuadorEgypt, Arab Rep.El SalvadorEquatorial GuineaEritreaEstoniaEthiopiaEuro areaEurope & Central AsiaEurope & Central Asia (excluding high income)Europe & Central Asia (IDA & IBRD countries)European UnionFaroe IslandsFijiFinlandFragile and conflict affected situationsFranceGabonGambia, TheGeorgiaGermanyGhanaGreeceGrenadaGuatemalaGuineaGuinea-BissauGuyanaHaitiHeavily indebted poor countries (HIPC)High incomeHondurasHong Kong SAR, ChinaHungaryIBRD onlyIcelandIDA & IBRD totalIDA blendIDA onlyIDA totalIndiaIndonesiaIran, Islamic Rep.IraqIrelandIsraelItalyJamaicaJapanJordanKazakhstanKenyaKiribatiKorea, Rep.KosovoKuwaitKyrgyz RepublicLao PDRLate-demographic dividendLatin America & Caribbean Latin America & Caribbean (excluding high income)Latin America & the Caribbean (IDA & IBRD countries)LatviaLeast developed countries: UN classificationLebanonLesothoLiberiaLibyaLithuaniaLow & middle incomeLow incomeLower middle incomeLuxembourgMacao SAR, ChinaMacedonia, FYRMadagascarMalawiMalaysiaMaldivesMaliMaltaMauritaniaMauritiusMexicoMiddle East & North AfricaMiddle East & North Africa (excluding high income)Middle East & North Africa (IDA & IBRD countries)Middle incomeMoldovaMongoliaMontenegroMoroccoMozambiqueNamibiaNepalNetherlandsNew ZealandNicaraguaNigerNigeriaNorth AmericaNorwayOECD membersOmanOther small statesPacific island small statesPakistanPanamaPapua New GuineaParaguayPeruPhilippinesPolandPortugalPost-demographic dividendPre-demographic dividendQatarRomaniaRussian FederationRwandaSaudi ArabiaSenegalSerbiaSeychellesSierra LeoneSingaporeSlovak RepublicSloveniaSmall statesSolomon IslandsSouth AfricaSouth AsiaSouth Asia (IDA & IBRD)South SudanSpainSri LankaSt. Kitts and NevisSt. LuciaSt. Vincent and the GrenadinesSub-Saharan Africa Sub-Saharan Africa (excluding high income)Sub-Saharan Africa (IDA & IBRD countries)SudanSurinameSwazilandSwedenSwitzerlandSyrian Arab RepublicTajikistanTanzaniaThailandTimor-LesteTogoTongaTrinidad and TobagoTunisiaTurkeyUgandaUkraineUnited KingdomUnited StatesUpper middle incomeUruguayVanuatuVenezuela, RBVietnamWest Bank and GazaWorldYemen, Rep.ZambiaZimbabwe Timeline:
This timeline shows a graph from 1977 to 2016 of Latin America & Caribbean . No data until 1976. Number of actual observations by date: 40.
Source name:
World Development Indicators
Source organization:
World Bank national accounts data, and OECD National Accounts data files.
Categories, topics:
Economy & Growth
Last updated:
apr 23, 2017
Indicators value changes by year
Minimum:
15.718
jan 1, 2000
Maximum:
25.468
jan 1, 1990
At the date of observation
Value
Absolute change
Change from previous value
jan 1, 1977
22.78
+22.78
0.0%
jan 1, 1978
22.229
-0.551
-2.42%
jan 1, 1979
21.473
-0.756
-3.4%
jan 1, 1980
20.836
-0.638
-2.97%
jan 1, 1981
20.544
-0.292
-1.4%
jan 1, 1982
19.665
-0.879
-4.28%
jan 1, 1983
17.099
-2.566
-13.05%
jan 1, 1984
16.726
-0.373
-2.18%
jan 1, 1985
17.393
+0.667
3.99%
jan 1, 1986
19.095
+1.702
9.79%
jan 1, 1987
16.9
-2.195
-11.49%
jan 1, 1988
20.082
+3.182
18.83%
jan 1, 1989
21.586
+1.504
7.49%
jan 1, 1990
25.468
+3.882
17.98%
jan 1, 1991
19.513
-5.955
-23.38%
jan 1, 1992
18.218
-1.295
-6.64%
jan 1, 1993
17.831
-0.387
-2.12%
jan 1, 1994
17.61
-0.221
-1.24%
jan 1, 1995
17.943
+0.333
1.89%
jan 1, 1996
16.659
-1.284
-7.16%
jan 1, 1997
16.613
-0.045
-0.27%
jan 1, 1998
16.386
-0.227
-1.37%
jan 1, 1999
15.823
-0.563
-3.44%
jan 1, 2000
15.718
-0.105
-0.66%
jan 1, 2001
16.865
+1.147
7.29%
jan 1, 2002
15.808
-1.056
-6.26%
jan 1, 2003
17.431
+1.623
10.27%
jan 1, 2004
18.529
+1.098
6.3%
jan 1, 2005
20.341
+1.812
9.78%
jan 1, 2006
20.618
+0.277
1.36%
jan 1, 2007
21.275
+0.657
3.19%
jan 1, 2008
21.828
+0.554
2.6%
jan 1, 2009
21.457
-0.371
-1.7%
jan 1, 2010
18.526
-2.932
-13.66%
jan 1, 2011
21.215
+2.689
14.51%
jan 1, 2012
21.245
+0.031
0.14%
jan 1, 2013
19.738
-1.508
-7.1%
jan 1, 2014
17.765
-1.973
-10.0%
jan 1, 2015
18.352
+0.587
3.31%
jan 1, 2016
17.165
-1.188
-6.47%
Ranking of countries by current statistics by years


Comments: