29
/
en
AIzaSyAYiBZKx7MnpbEhh9jyipgxe19OcubqV5w
April 1, 2024
136801
Gambia, The
GMB
true
2
1
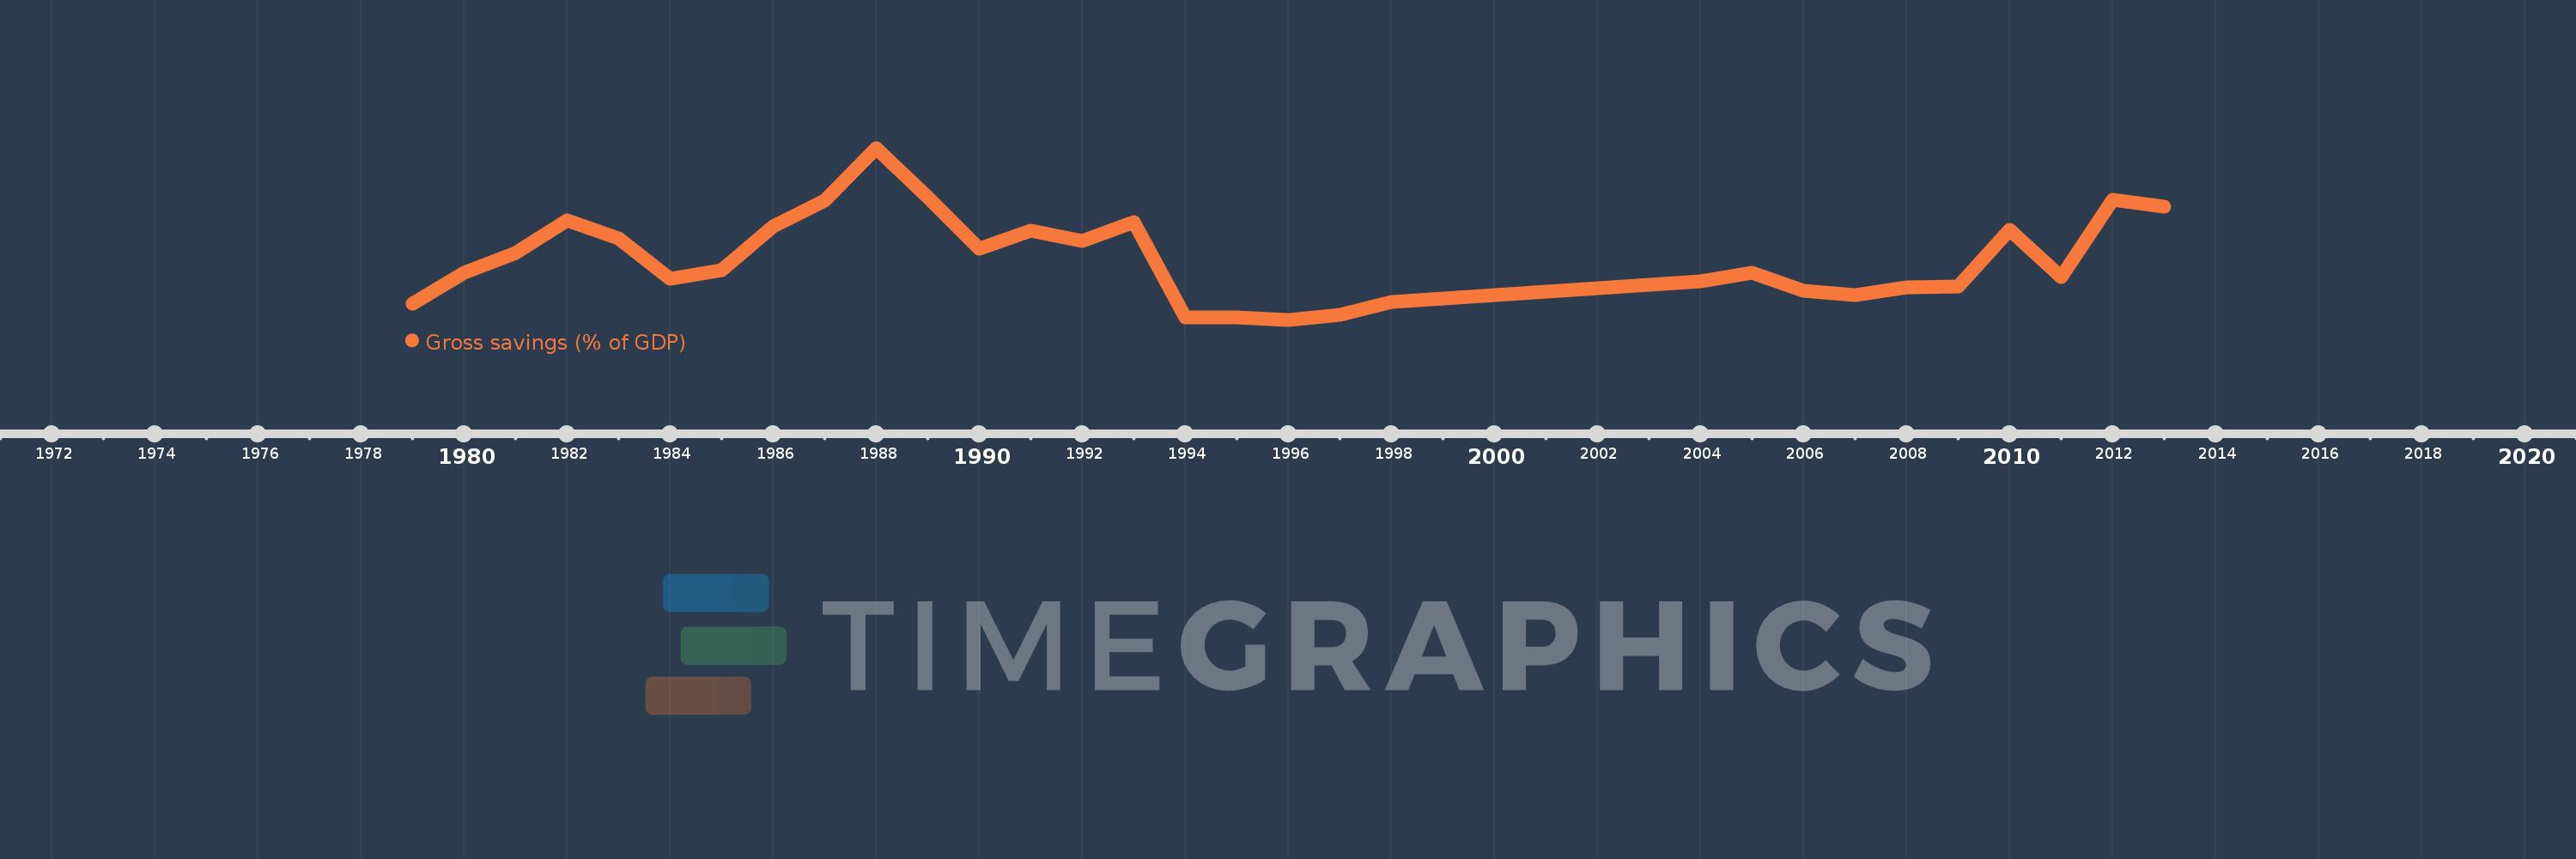
Gross savings (% of GDP)
2013,2012,2011,2010,2009,2008,2007,2006,2005,2004,1998,1997,1996,1995,1994,1993,1992,1991,1990,1989,1988,1987,1986,1985,1984,1983,1982,1981,1980,1979
This statistics in other country:
AfghanistanAlbaniaAlgeriaAngolaAntigua and BarbudaArab WorldArgentinaArmeniaAustraliaAustriaAzerbaijanBahamas, TheBahrainBangladeshBarbadosBelarusBelgiumBelizeBeninBermudaBhutanBoliviaBosnia and HerzegovinaBotswanaBrazilBrunei DarussalamBulgariaBurkina FasoBurundiCabo VerdeCambodiaCameroonCanadaCaribbean small statesCentral African RepublicCentral Europe and the BalticsChadChileChinaColombiaComorosCongo, Dem. Rep.Congo, Rep.Costa RicaCote d'IvoireCroatiaCyprusCzech RepublicDenmarkDjiboutiDominicaDominican RepublicEarly-demographic dividendEast Asia & PacificEast Asia & Pacific (excluding high income)East Asia & Pacific (IDA & IBRD countries)EcuadorEgypt, Arab Rep.El SalvadorEquatorial GuineaEritreaEstoniaEthiopiaEuro areaEurope & Central AsiaEurope & Central Asia (excluding high income)Europe & Central Asia (IDA & IBRD countries)European UnionFaroe IslandsFijiFinlandFragile and conflict affected situationsFranceGabonGambia, TheGeorgiaGermanyGhanaGreeceGrenadaGuatemalaGuineaGuinea-BissauGuyanaHaitiHeavily indebted poor countries (HIPC)High incomeHondurasHong Kong SAR, ChinaHungaryIBRD onlyIcelandIDA & IBRD totalIDA blendIDA onlyIDA totalIndiaIndonesiaIran, Islamic Rep.IraqIrelandIsraelItalyJamaicaJapanJordanKazakhstanKenyaKiribatiKorea, Rep.KosovoKuwaitKyrgyz RepublicLao PDRLate-demographic dividendLatin America & Caribbean Latin America & Caribbean (excluding high income)Latin America & the Caribbean (IDA & IBRD countries)LatviaLeast developed countries: UN classificationLebanonLesothoLiberiaLibyaLithuaniaLow & middle incomeLow incomeLower middle incomeLuxembourgMacao SAR, ChinaMacedonia, FYRMadagascarMalawiMalaysiaMaldivesMaliMaltaMauritaniaMauritiusMexicoMiddle East & North AfricaMiddle East & North Africa (excluding high income)Middle East & North Africa (IDA & IBRD countries)Middle incomeMoldovaMongoliaMontenegroMoroccoMozambiqueNamibiaNepalNetherlandsNew ZealandNicaraguaNigerNigeriaNorth AmericaNorwayOECD membersOmanOther small statesPacific island small statesPakistanPanamaPapua New GuineaParaguayPeruPhilippinesPolandPortugalPost-demographic dividendPre-demographic dividendQatarRomaniaRussian FederationRwandaSaudi ArabiaSenegalSerbiaSeychellesSierra LeoneSingaporeSlovak RepublicSloveniaSmall statesSolomon IslandsSouth AfricaSouth AsiaSouth Asia (IDA & IBRD)South SudanSpainSri LankaSt. Kitts and NevisSt. LuciaSt. Vincent and the GrenadinesSub-Saharan Africa Sub-Saharan Africa (excluding high income)Sub-Saharan Africa (IDA & IBRD countries)SudanSurinameSwazilandSwedenSwitzerlandSyrian Arab RepublicTajikistanTanzaniaThailandTimor-LesteTogoTongaTrinidad and TobagoTunisiaTurkeyUgandaUkraineUnited KingdomUnited StatesUpper middle incomeUruguayVanuatuVenezuela, RBVietnamWest Bank and GazaWorldYemen, Rep.ZambiaZimbabwe Timeline:
This timeline shows a graph from 1979 to 2013 of Gambia, The. No data until 1978. Number of actual observations by date: 30.
Source name:
World Development Indicators
Source organization:
World Bank national accounts data, and OECD National Accounts data files.
Categories, topics:
Economy & Growth
Last updated:
apr 23, 2017
Indicators value changes by year
Maximum:
42.297
jan 1, 1988
At the date of observation
Value
Absolute change
Change from previous value
jan 1, 1979
3.805
+3.805
0.0%
jan 1, 1980
11.383
+7.577
199.12%
jan 1, 1981
16.355
+4.972
43.68%
jan 1, 1982
24.29
+7.935
48.52%
jan 1, 1983
19.868
-4.422
-18.21%
jan 1, 1984
10.041
-9.826
-49.46%
jan 1, 1985
12.137
+2.096
20.87%
jan 1, 1986
22.881
+10.744
88.52%
jan 1, 1987
29.35
+6.469
28.27%
jan 1, 1988
42.297
+12.947
44.11%
jan 1, 1989
30.115
-12.183
-28.8%
jan 1, 1990
17.457
-12.658
-42.03%
jan 1, 1991
21.854
+4.397
25.18%
jan 1, 1992
19.373
-2.48
-11.35%
jan 1, 1993
24.054
+4.68
24.16%
jan 1, 1994
0.489
-23.564
-97.97%
jan 1, 1995
0.364
-0.125
-25.59%
jan 1, 1996
-0.19
-0.554
-152.32%
jan 1, 1997
0.985
+1.175
-617.03%
jan 1, 1998
4.23
+3.245
329.54%
jan 1, 2004
9.247
+5.018
118.64%
jan 1, 2005
11.338
+2.091
22.61%
jan 1, 2006
6.981
-4.357
-38.43%
jan 1, 2007
5.812
-1.169
-16.74%
jan 1, 2008
7.788
+1.975
33.99%
jan 1, 2009
7.965
+0.177
2.28%
jan 1, 2010
22.077
+14.112
177.17%
jan 1, 2011
10.44
-11.637
-52.71%
jan 1, 2012
29.416
+18.976
181.75%
jan 1, 2013
27.881
-1.535
-5.22%
Ranking of countries by current statistics by years


Comments: