29
/
en
AIzaSyAYiBZKx7MnpbEhh9jyipgxe19OcubqV5w
April 1, 2024
107323
Colombia
COL
true
2
1
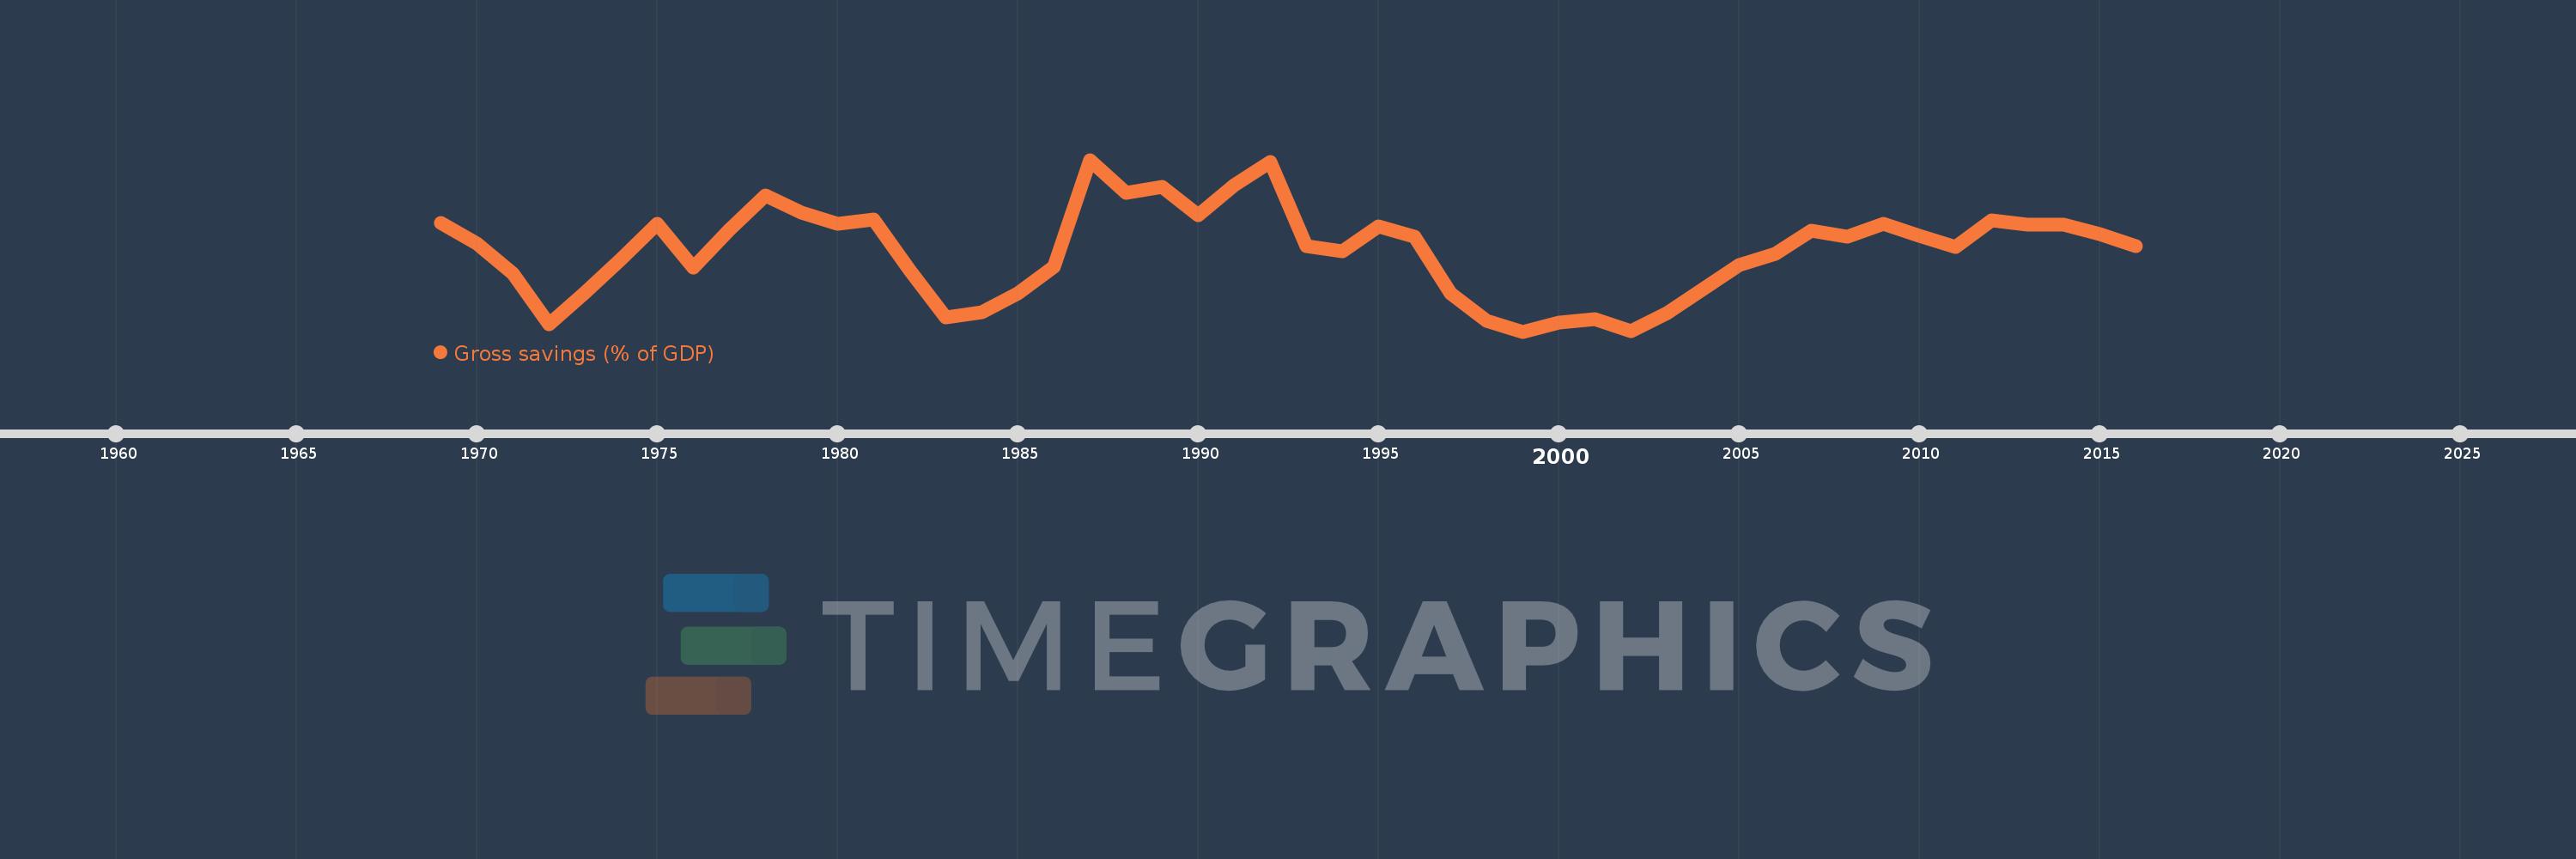
Gross savings (% of GDP)
2016,2015,2014,2013,2012,2011,2010,2009,2008,2007,2006,2005,2004,2003,2002,2001,2000,1999,1998,1997,1996,1995,1994,1993,1992,1991,1990,1989,1988,1987,1986,1985,1984,1983,1982,1981,1980,1979,1978,1977,1976,1975,1974,1973,1972,1971,1970,1969
This statistics in other country:
AfghanistanAlbaniaAlgeriaAngolaAntigua and BarbudaArab WorldArgentinaArmeniaAustraliaAustriaAzerbaijanBahamas, TheBahrainBangladeshBarbadosBelarusBelgiumBelizeBeninBermudaBhutanBoliviaBosnia and HerzegovinaBotswanaBrazilBrunei DarussalamBulgariaBurkina FasoBurundiCabo VerdeCambodiaCameroonCanadaCaribbean small statesCentral African RepublicCentral Europe and the BalticsChadChileChinaColombiaComorosCongo, Dem. Rep.Congo, Rep.Costa RicaCote d'IvoireCroatiaCyprusCzech RepublicDenmarkDjiboutiDominicaDominican RepublicEarly-demographic dividendEast Asia & PacificEast Asia & Pacific (excluding high income)East Asia & Pacific (IDA & IBRD countries)EcuadorEgypt, Arab Rep.El SalvadorEquatorial GuineaEritreaEstoniaEthiopiaEuro areaEurope & Central AsiaEurope & Central Asia (excluding high income)Europe & Central Asia (IDA & IBRD countries)European UnionFaroe IslandsFijiFinlandFragile and conflict affected situationsFranceGabonGambia, TheGeorgiaGermanyGhanaGreeceGrenadaGuatemalaGuineaGuinea-BissauGuyanaHaitiHeavily indebted poor countries (HIPC)High incomeHondurasHong Kong SAR, ChinaHungaryIBRD onlyIcelandIDA & IBRD totalIDA blendIDA onlyIDA totalIndiaIndonesiaIran, Islamic Rep.IraqIrelandIsraelItalyJamaicaJapanJordanKazakhstanKenyaKiribatiKorea, Rep.KosovoKuwaitKyrgyz RepublicLao PDRLate-demographic dividendLatin America & Caribbean Latin America & Caribbean (excluding high income)Latin America & the Caribbean (IDA & IBRD countries)LatviaLeast developed countries: UN classificationLebanonLesothoLiberiaLibyaLithuaniaLow & middle incomeLow incomeLower middle incomeLuxembourgMacao SAR, ChinaMacedonia, FYRMadagascarMalawiMalaysiaMaldivesMaliMaltaMauritaniaMauritiusMexicoMiddle East & North AfricaMiddle East & North Africa (excluding high income)Middle East & North Africa (IDA & IBRD countries)Middle incomeMoldovaMongoliaMontenegroMoroccoMozambiqueNamibiaNepalNetherlandsNew ZealandNicaraguaNigerNigeriaNorth AmericaNorwayOECD membersOmanOther small statesPacific island small statesPakistanPanamaPapua New GuineaParaguayPeruPhilippinesPolandPortugalPost-demographic dividendPre-demographic dividendQatarRomaniaRussian FederationRwandaSaudi ArabiaSenegalSerbiaSeychellesSierra LeoneSingaporeSlovak RepublicSloveniaSmall statesSolomon IslandsSouth AfricaSouth AsiaSouth Asia (IDA & IBRD)South SudanSpainSri LankaSt. Kitts and NevisSt. LuciaSt. Vincent and the GrenadinesSub-Saharan Africa Sub-Saharan Africa (excluding high income)Sub-Saharan Africa (IDA & IBRD countries)SudanSurinameSwazilandSwedenSwitzerlandSyrian Arab RepublicTajikistanTanzaniaThailandTimor-LesteTogoTongaTrinidad and TobagoTunisiaTurkeyUgandaUkraineUnited KingdomUnited StatesUpper middle incomeUruguayVanuatuVenezuela, RBVietnamWest Bank and GazaWorldYemen, Rep.ZambiaZimbabwe Timeline:
This timeline shows a graph from 1969 to 2016 of Colombia. No data until 1968. Number of actual observations by date: 48.
Source name:
World Development Indicators
Source organization:
World Bank national accounts data, and OECD National Accounts data files.
Categories, topics:
Economy & Growth
Last updated:
apr 23, 2017
Indicators value changes by year
Minimum:
12.809
jan 1, 1999
Maximum:
23.173
jan 1, 1987
At the date of observation
Value
Absolute change
Change from previous value
jan 1, 1969
19.344
+19.344
0.0%
jan 1, 1970
18.117
-1.227
-6.34%
jan 1, 1971
16.317
-1.8
-9.93%
jan 1, 1972
13.266
-3.051
-18.7%
jan 1, 1973
15.168
+1.902
14.33%
jan 1, 1974
17.196
+2.029
13.38%
jan 1, 1975
19.333
+2.137
12.43%
jan 1, 1976
16.66
-2.673
-13.83%
jan 1, 1977
18.932
+2.272
13.64%
jan 1, 1978
21.046
+2.114
11.16%
jan 1, 1979
19.994
-1.051
-4.99%
jan 1, 1980
19.291
-0.703
-3.52%
jan 1, 1981
19.555
+0.264
1.37%
jan 1, 1982
16.502
-3.054
-15.62%
jan 1, 1983
13.649
-2.853
-17.29%
jan 1, 1984
13.979
+0.33
2.42%
jan 1, 1985
15.121
+1.142
8.17%
jan 1, 1986
16.726
+1.605
10.62%
jan 1, 1987
23.173
+6.447
38.54%
jan 1, 1988
21.201
-1.972
-8.51%
jan 1, 1989
21.518
+0.318
1.5%
jan 1, 1990
19.843
-1.676
-7.79%
jan 1, 1991
21.63
+1.787
9.01%
jan 1, 1992
23.059
+1.429
6.61%
jan 1, 1993
17.989
-5.07
-21.99%
jan 1, 1994
17.66
-0.33
-1.83%
jan 1, 1995
19.149
+1.489
8.43%
jan 1, 1996
18.525
-0.623
-3.26%
jan 1, 1997
15.119
-3.406
-18.39%
jan 1, 1998
13.455
-1.664
-11.0%
jan 1, 1999
12.809
-0.646
-4.8%
jan 1, 2000
13.355
+0.546
4.26%
jan 1, 2001
13.575
+0.22
1.64%
jan 1, 2002
12.834
-0.74
-5.45%
jan 1, 2003
13.923
+1.089
8.49%
jan 1, 2004
15.397
+1.474
10.58%
jan 1, 2005
16.829
+1.432
9.3%
jan 1, 2006
17.478
+0.649
3.86%
jan 1, 2007
18.903
+1.425
8.15%
jan 1, 2008
18.522
-0.381
-2.02%
jan 1, 2009
19.334
+0.812
4.38%
jan 1, 2010
18.597
-0.737
-3.81%
jan 1, 2011
17.939
-0.658
-3.54%
jan 1, 2012
19.505
+1.566
8.73%
jan 1, 2013
19.268
-0.238
-1.22%
jan 1, 2014
19.267
-0.001
0.0%
jan 1, 2015
18.712
-0.555
-2.88%
jan 1, 2016
17.972
-0.739
-3.95%
Ranking of countries by current statistics by years


Comments: