29
/
en
AIzaSyAYiBZKx7MnpbEhh9jyipgxe19OcubqV5w
April 1, 2024
50455
Middle East & North Africa (IDA & IBRD countries)
TMN
false
2
1
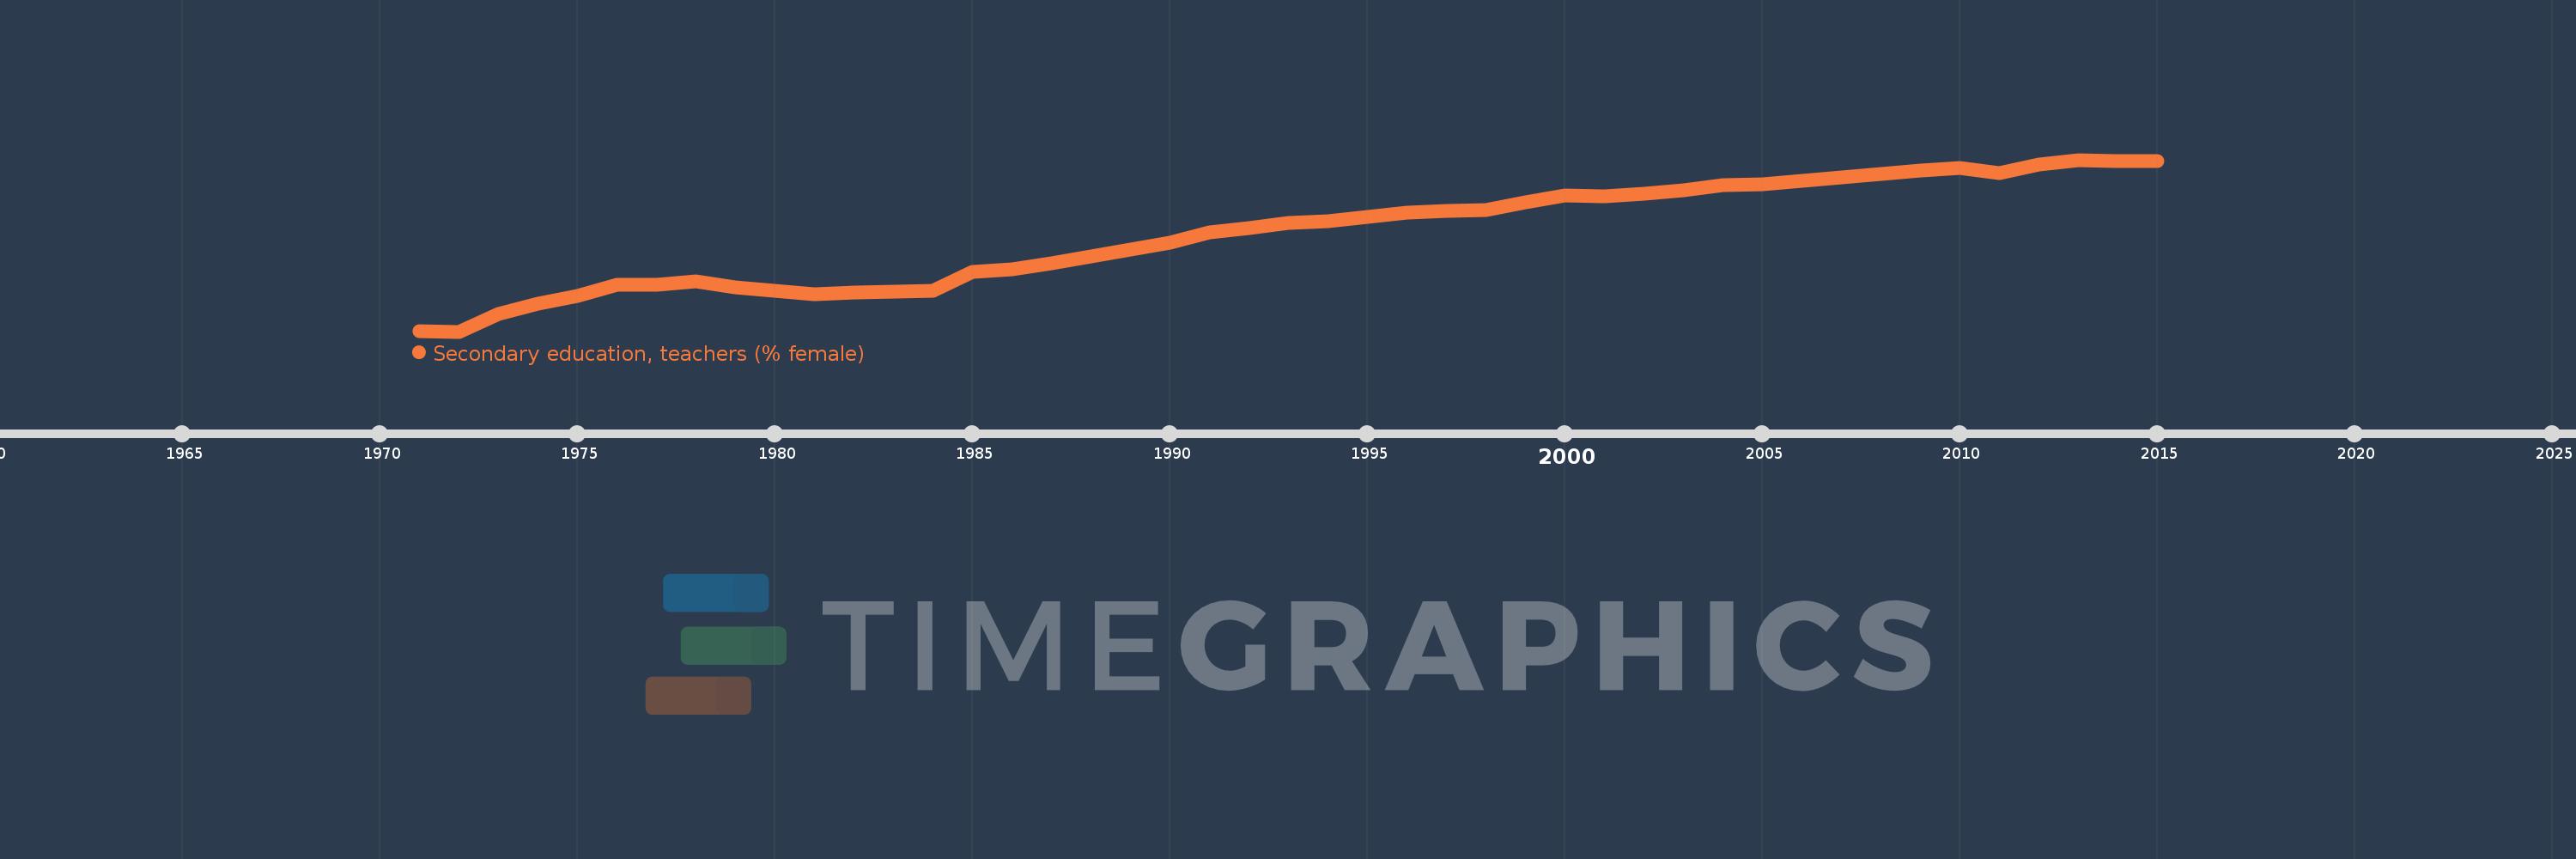
Secondary education, teachers (% female)
2015,2014,2013,2012,2011,2010,2009,2008,2007,2006,2005,2004,2003,2002,2001,2000,1999,1998,1997,1996,1995,1994,1993,1992,1991,1990,1989,1988,1987,1986,1985,1984,1983,1982,1981,1980,1979,1978,1977,1976,1975,1974,1973,1972,1971
This statistics in other country:
AfghanistanAlbaniaAlgeriaAndorraAngolaAntigua and BarbudaArab WorldArgentinaArmeniaArubaAustraliaAustriaBahamas, TheBahrainBangladeshBarbadosBelarusBelgiumBelizeBeninBermudaBhutanBoliviaBosnia and HerzegovinaBotswanaBrazilBritish Virgin IslandsBrunei DarussalamBulgariaBurkina FasoBurundiCabo VerdeCambodiaCameroonCanadaCaribbean small statesCayman IslandsCentral African RepublicCentral Europe and the BalticsChadChileChinaColombiaComorosCongo, Dem. Rep.Congo, Rep.Costa RicaCote d'IvoireCroatiaCubaCyprusCzech RepublicDenmarkDjiboutiDominicaDominican RepublicEarly-demographic dividendEast Asia & PacificEast Asia & Pacific (excluding high income)East Asia & Pacific (IDA & IBRD countries)EcuadorEgypt, Arab Rep.El SalvadorEquatorial GuineaEritreaEstoniaEthiopiaEuro areaEurope & Central AsiaEurope & Central Asia (excluding high income)Europe & Central Asia (IDA & IBRD countries)European UnionFijiFinlandFragile and conflict affected situationsFranceGabonGambia, TheGeorgiaGermanyGhanaGibraltarGreeceGrenadaGuatemalaGuineaGuinea-BissauGuyanaHeavily indebted poor countries (HIPC)High incomeHondurasHong Kong SAR, ChinaHungaryIBRD onlyIcelandIDA & IBRD totalIDA blendIDA onlyIDA totalIndiaIndonesiaIran, Islamic Rep.IraqIrelandIsraelItalyJamaicaJapanJordanKazakhstanKenyaKiribatiKorea, Dem. People’s Rep.Korea, Rep.KuwaitKyrgyz RepublicLao PDRLate-demographic dividendLatin America & Caribbean Latin America & Caribbean (excluding high income)Latin America & the Caribbean (IDA & IBRD countries)LatviaLeast developed countries: UN classificationLebanonLesothoLiberiaLibyaLiechtensteinLithuaniaLow & middle incomeLow incomeLower middle incomeLuxembourgMacao SAR, ChinaMacedonia, FYRMadagascarMalawiMalaysiaMaldivesMaliMaltaMarshall IslandsMauritaniaMauritiusMexicoMiddle East & North AfricaMiddle East & North Africa (excluding high income)Middle East & North Africa (IDA & IBRD countries)Middle incomeMoldovaMonacoMongoliaMoroccoMozambiqueMyanmarNamibiaNauruNepalNetherlandsNew ZealandNicaraguaNigerNigeriaNorth AmericaNorwayOECD membersOmanOther small statesPacific island small statesPakistanPalauPanamaPapua New GuineaParaguayPeruPhilippinesPolandPortugalPost-demographic dividendPre-demographic dividendPuerto RicoQatarRomaniaRussian FederationRwandaSamoaSan MarinoSao Tome and PrincipeSaudi ArabiaSenegalSerbiaSeychellesSierra LeoneSingaporeSint Maarten (Dutch part)Slovak RepublicSloveniaSmall statesSolomon IslandsSomaliaSouth AfricaSouth AsiaSouth Asia (IDA & IBRD)SpainSri LankaSt. Kitts and NevisSt. LuciaSt. Vincent and the GrenadinesSub-Saharan Africa Sub-Saharan Africa (excluding high income)Sub-Saharan Africa (IDA & IBRD countries)SudanSurinameSwazilandSwedenSwitzerlandSyrian Arab RepublicTajikistanTanzaniaThailandTimor-LesteTogoTongaTrinidad and TobagoTunisiaTurkeyTurks and Caicos IslandsUgandaUkraineUnited Arab EmiratesUnited KingdomUnited StatesUpper middle incomeUruguayUzbekistanVanuatuVenezuela, RBVietnamWest Bank and GazaWorldYemen, Rep.ZambiaZimbabwe Timeline:
This timeline shows a graph from 1971 to 2015 of Middle East & North Africa (IDA & IBRD countries). No data until 1970. Number of actual observations by date: 45.
Source name:
World Development Indicators
Source organization:
United Nations Educational, Scientific, and Cultural Organization (UNESCO) Institute for Statistics.
Categories, topics:
Education, Gender
Last updated:
apr 23, 2017
Indicators value changes by year
Minimum:
27.616
jan 1, 1972
Maximum:
46.376
jan 1, 2013
At the date of observation
Value
Absolute change
Change from previous value
jan 1, 1971
27.624
+27.624
0.0%
jan 1, 1972
27.616
-0.008
-0.03%
jan 1, 1973
29.521
+1.906
6.9%
jan 1, 1974
30.651
+1.13
3.83%
jan 1, 1975
31.522
+0.871
2.84%
jan 1, 1976
32.685
+1.163
3.69%
jan 1, 1977
32.744
+0.059
0.18%
jan 1, 1978
33.15
+0.406
1.24%
jan 1, 1979
32.48
-0.67
-2.02%
jan 1, 1980
32.116
-0.364
-1.12%
jan 1, 1981
31.723
-0.393
-1.22%
jan 1, 1982
31.871
+0.148
0.47%
jan 1, 1983
31.959
+0.088
0.28%
jan 1, 1984
32.07
+0.112
0.35%
jan 1, 1985
34.162
+2.091
6.52%
jan 1, 1986
34.394
+0.233
0.68%
jan 1, 1987
35.073
+0.678
1.97%
jan 1, 1988
35.844
+0.771
2.2%
jan 1, 1989
36.568
+0.724
2.02%
jan 1, 1990
37.356
+0.788
2.15%
jan 1, 1991
38.464
+1.108
2.97%
jan 1, 1992
38.915
+0.451
1.17%
jan 1, 1993
39.44
+0.525
1.35%
jan 1, 1994
39.657
+0.217
0.55%
jan 1, 1995
40.164
+0.507
1.28%
jan 1, 1996
40.575
+0.411
1.02%
jan 1, 1997
40.823
+0.248
0.61%
jan 1, 1998
40.904
+0.081
0.2%
jan 1, 1999
41.748
+0.844
2.06%
jan 1, 2000
42.52
+0.772
1.85%
jan 1, 2001
42.409
-0.111
-0.26%
jan 1, 2002
42.644
+0.235
0.55%
jan 1, 2003
43.016
+0.371
0.87%
jan 1, 2004
43.601
+0.585
1.36%
jan 1, 2005
43.67
+0.069
0.16%
jan 1, 2006
44.072
+0.403
0.92%
jan 1, 2007
44.457
+0.385
0.87%
jan 1, 2008
44.817
+0.36
0.81%
jan 1, 2009
45.211
+0.394
0.88%
jan 1, 2010
45.509
+0.298
0.66%
jan 1, 2011
44.956
-0.553
-1.22%
jan 1, 2012
45.828
+0.873
1.94%
jan 1, 2013
46.376
+0.547
1.19%
jan 1, 2014
46.26
-0.116
-0.25%
jan 1, 2015
46.248
-0.013
-0.03%
Ranking of countries by current statistics by years


Comments: