29
/
en
AIzaSyAYiBZKx7MnpbEhh9jyipgxe19OcubqV5w
April 1, 2024
29501
East Asia & Pacific (IDA & IBRD countries)
TEA
false
2
1
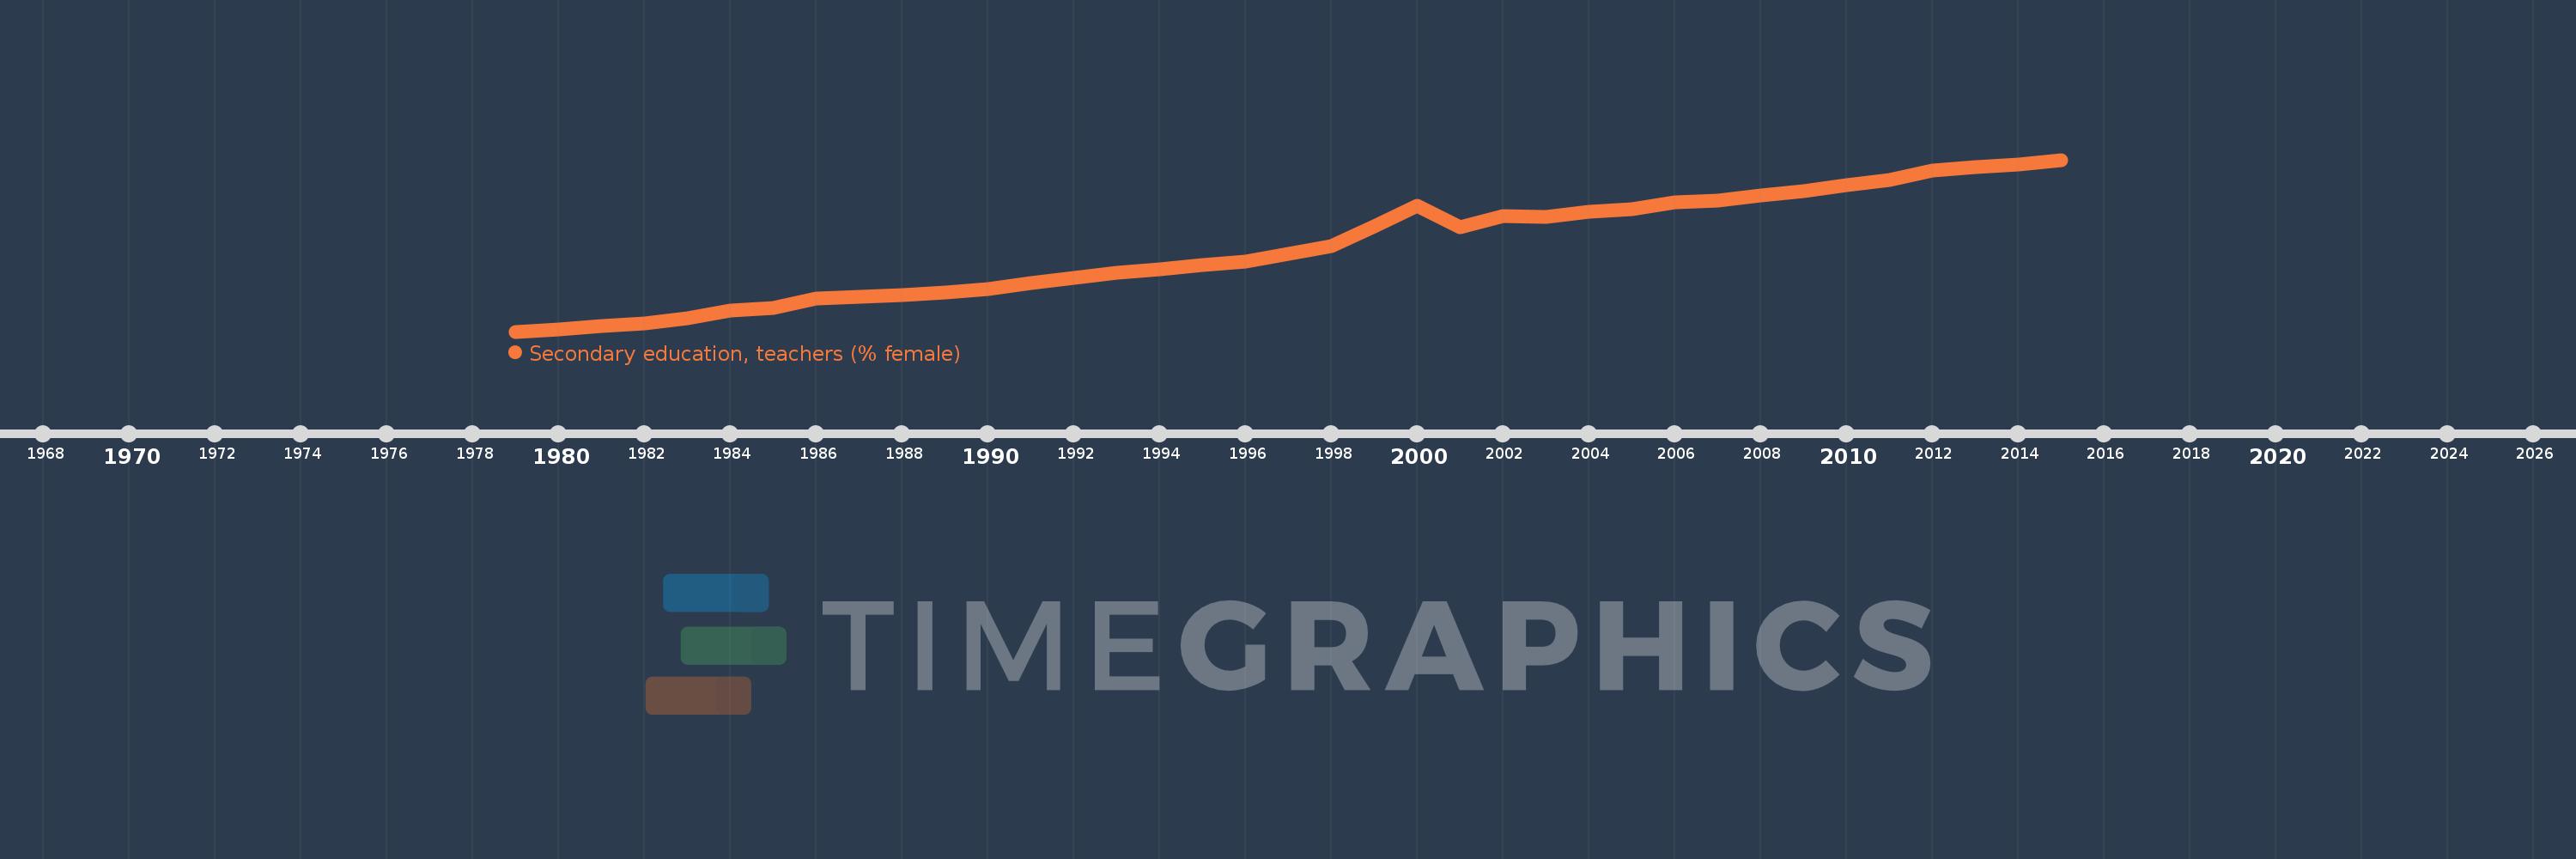
Secondary education, teachers (% female)
2015,2014,2013,2012,2011,2010,2009,2008,2007,2006,2005,2004,2003,2002,2001,2000,1999,1998,1997,1996,1995,1994,1993,1992,1991,1990,1989,1988,1987,1986,1985,1984,1983,1982,1981,1980,1979
This statistics in other country:
AfghanistanAlbaniaAlgeriaAndorraAngolaAntigua and BarbudaArab WorldArgentinaArmeniaArubaAustraliaAustriaBahamas, TheBahrainBangladeshBarbadosBelarusBelgiumBelizeBeninBermudaBhutanBoliviaBosnia and HerzegovinaBotswanaBrazilBritish Virgin IslandsBrunei DarussalamBulgariaBurkina FasoBurundiCabo VerdeCambodiaCameroonCanadaCaribbean small statesCayman IslandsCentral African RepublicCentral Europe and the BalticsChadChileChinaColombiaComorosCongo, Dem. Rep.Congo, Rep.Costa RicaCote d'IvoireCroatiaCubaCyprusCzech RepublicDenmarkDjiboutiDominicaDominican RepublicEarly-demographic dividendEast Asia & PacificEast Asia & Pacific (excluding high income)East Asia & Pacific (IDA & IBRD countries)EcuadorEgypt, Arab Rep.El SalvadorEquatorial GuineaEritreaEstoniaEthiopiaEuro areaEurope & Central AsiaEurope & Central Asia (excluding high income)Europe & Central Asia (IDA & IBRD countries)European UnionFijiFinlandFragile and conflict affected situationsFranceGabonGambia, TheGeorgiaGermanyGhanaGibraltarGreeceGrenadaGuatemalaGuineaGuinea-BissauGuyanaHeavily indebted poor countries (HIPC)High incomeHondurasHong Kong SAR, ChinaHungaryIBRD onlyIcelandIDA & IBRD totalIDA blendIDA onlyIDA totalIndiaIndonesiaIran, Islamic Rep.IraqIrelandIsraelItalyJamaicaJapanJordanKazakhstanKenyaKiribatiKorea, Dem. People’s Rep.Korea, Rep.KuwaitKyrgyz RepublicLao PDRLate-demographic dividendLatin America & Caribbean Latin America & Caribbean (excluding high income)Latin America & the Caribbean (IDA & IBRD countries)LatviaLeast developed countries: UN classificationLebanonLesothoLiberiaLibyaLiechtensteinLithuaniaLow & middle incomeLow incomeLower middle incomeLuxembourgMacao SAR, ChinaMacedonia, FYRMadagascarMalawiMalaysiaMaldivesMaliMaltaMarshall IslandsMauritaniaMauritiusMexicoMiddle East & North AfricaMiddle East & North Africa (excluding high income)Middle East & North Africa (IDA & IBRD countries)Middle incomeMoldovaMonacoMongoliaMoroccoMozambiqueMyanmarNamibiaNauruNepalNetherlandsNew ZealandNicaraguaNigerNigeriaNorth AmericaNorwayOECD membersOmanOther small statesPacific island small statesPakistanPalauPanamaPapua New GuineaParaguayPeruPhilippinesPolandPortugalPost-demographic dividendPre-demographic dividendPuerto RicoQatarRomaniaRussian FederationRwandaSamoaSan MarinoSao Tome and PrincipeSaudi ArabiaSenegalSerbiaSeychellesSierra LeoneSingaporeSint Maarten (Dutch part)Slovak RepublicSloveniaSmall statesSolomon IslandsSomaliaSouth AfricaSouth AsiaSouth Asia (IDA & IBRD)SpainSri LankaSt. Kitts and NevisSt. LuciaSt. Vincent and the GrenadinesSub-Saharan Africa Sub-Saharan Africa (excluding high income)Sub-Saharan Africa (IDA & IBRD countries)SudanSurinameSwazilandSwedenSwitzerlandSyrian Arab RepublicTajikistanTanzaniaThailandTimor-LesteTogoTongaTrinidad and TobagoTunisiaTurkeyTurks and Caicos IslandsUgandaUkraineUnited Arab EmiratesUnited KingdomUnited StatesUpper middle incomeUruguayUzbekistanVanuatuVenezuela, RBVietnamWest Bank and GazaWorldYemen, Rep.ZambiaZimbabwe Timeline:
This timeline shows a graph from 1979 to 2015 of East Asia & Pacific (IDA & IBRD countries). No data until 1978. Number of actual observations by date: 37.
Source name:
World Development Indicators
Source organization:
United Nations Educational, Scientific, and Cultural Organization (UNESCO) Institute for Statistics.
Categories, topics:
Education, Gender
Last updated:
apr 23, 2017
Indicators value changes by year
Minimum:
28.073
jan 1, 1979
Maximum:
53.148
jan 1, 2015
At the date of observation
Value
Absolute change
Change from previous value
jan 1, 1979
28.073
+28.073
0.0%
jan 1, 1980
28.408
+0.335
1.19%
jan 1, 1981
28.881
+0.473
1.66%
jan 1, 1982
29.273
+0.392
1.36%
jan 1, 1983
30.023
+0.751
2.56%
jan 1, 1984
31.105
+1.081
3.6%
jan 1, 1985
31.48
+0.375
1.21%
jan 1, 1986
32.889
+1.409
4.48%
jan 1, 1987
33.17
+0.281
0.85%
jan 1, 1988
33.442
+0.273
0.82%
jan 1, 1989
33.839
+0.397
1.19%
jan 1, 1990
34.29
+0.451
1.33%
jan 1, 1991
35.184
+0.894
2.61%
jan 1, 1992
35.899
+0.715
2.03%
jan 1, 1993
36.63
+0.731
2.04%
jan 1, 1994
37.192
+0.561
1.53%
jan 1, 1995
37.771
+0.58
1.56%
jan 1, 1996
38.34
+0.569
1.51%
jan 1, 1997
39.418
+1.079
2.81%
jan 1, 1998
40.499
+1.081
2.74%
jan 1, 1999
43.388
+2.889
7.13%
jan 1, 2000
46.414
+3.026
6.97%
jan 1, 2001
43.366
-3.048
-6.57%
jan 1, 2002
44.986
+1.62
3.74%
jan 1, 2003
44.867
-0.12
-0.27%
jan 1, 2004
45.582
+0.715
1.59%
jan 1, 2005
45.877
+0.295
0.65%
jan 1, 2006
46.894
+1.018
2.22%
jan 1, 2007
47.146
+0.252
0.54%
jan 1, 2008
47.949
+0.802
1.7%
jan 1, 2009
48.579
+0.631
1.32%
jan 1, 2010
49.479
+0.899
1.85%
jan 1, 2011
50.189
+0.71
1.44%
jan 1, 2012
51.643
+1.454
2.9%
jan 1, 2013
52.049
+0.406
0.79%
jan 1, 2014
52.425
+0.376
0.72%
jan 1, 2015
53.148
+0.723
1.38%
Ranking of countries by current statistics by years


Comments: