29
/
en
AIzaSyAYiBZKx7MnpbEhh9jyipgxe19OcubqV5w
April 1, 2024
141107
Ghana
GHA
true
2
1
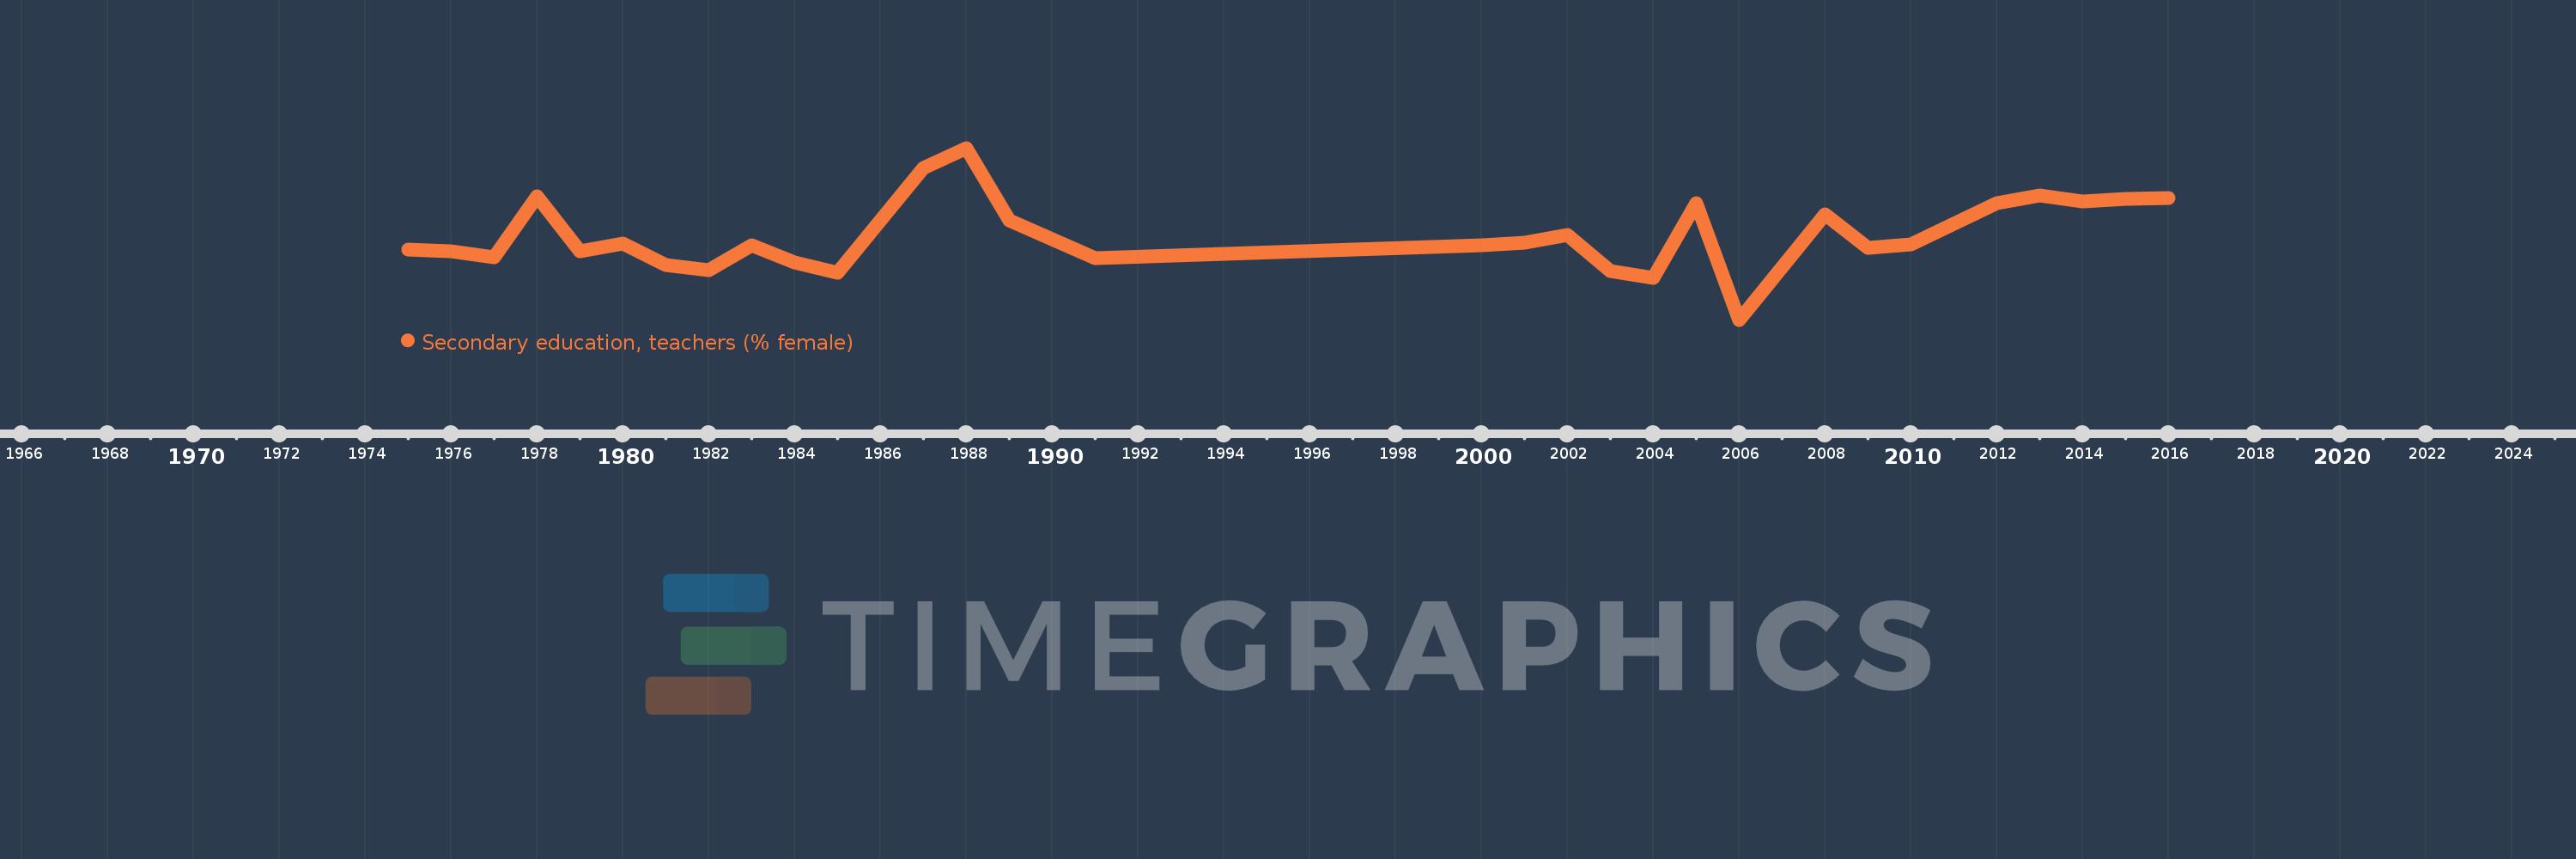
Secondary education, teachers (% female)
2016,2015,2014,2013,2012,2010,2009,2008,2006,2005,2004,2003,2002,2001,2000,1991,1989,1988,1987,1985,1984,1983,1982,1981,1980,1979,1978,1977,1976,1975
This statistics in other country:
AfghanistanAlbaniaAlgeriaAndorraAngolaAntigua and BarbudaArab WorldArgentinaArmeniaArubaAustraliaAustriaBahamas, TheBahrainBangladeshBarbadosBelarusBelgiumBelizeBeninBermudaBhutanBoliviaBosnia and HerzegovinaBotswanaBrazilBritish Virgin IslandsBrunei DarussalamBulgariaBurkina FasoBurundiCabo VerdeCambodiaCameroonCanadaCaribbean small statesCayman IslandsCentral African RepublicCentral Europe and the BalticsChadChileChinaColombiaComorosCongo, Dem. Rep.Congo, Rep.Costa RicaCote d'IvoireCroatiaCubaCyprusCzech RepublicDenmarkDjiboutiDominicaDominican RepublicEarly-demographic dividendEast Asia & PacificEast Asia & Pacific (excluding high income)East Asia & Pacific (IDA & IBRD countries)EcuadorEgypt, Arab Rep.El SalvadorEquatorial GuineaEritreaEstoniaEthiopiaEuro areaEurope & Central AsiaEurope & Central Asia (excluding high income)Europe & Central Asia (IDA & IBRD countries)European UnionFijiFinlandFragile and conflict affected situationsFranceGabonGambia, TheGeorgiaGermanyGhanaGibraltarGreeceGrenadaGuatemalaGuineaGuinea-BissauGuyanaHeavily indebted poor countries (HIPC)High incomeHondurasHong Kong SAR, ChinaHungaryIBRD onlyIcelandIDA & IBRD totalIDA blendIDA onlyIDA totalIndiaIndonesiaIran, Islamic Rep.IraqIrelandIsraelItalyJamaicaJapanJordanKazakhstanKenyaKiribatiKorea, Dem. People’s Rep.Korea, Rep.KuwaitKyrgyz RepublicLao PDRLate-demographic dividendLatin America & Caribbean Latin America & Caribbean (excluding high income)Latin America & the Caribbean (IDA & IBRD countries)LatviaLeast developed countries: UN classificationLebanonLesothoLiberiaLibyaLiechtensteinLithuaniaLow & middle incomeLow incomeLower middle incomeLuxembourgMacao SAR, ChinaMacedonia, FYRMadagascarMalawiMalaysiaMaldivesMaliMaltaMarshall IslandsMauritaniaMauritiusMexicoMiddle East & North AfricaMiddle East & North Africa (excluding high income)Middle East & North Africa (IDA & IBRD countries)Middle incomeMoldovaMonacoMongoliaMoroccoMozambiqueMyanmarNamibiaNauruNepalNetherlandsNew ZealandNicaraguaNigerNigeriaNorth AmericaNorwayOECD membersOmanOther small statesPacific island small statesPakistanPalauPanamaPapua New GuineaParaguayPeruPhilippinesPolandPortugalPost-demographic dividendPre-demographic dividendPuerto RicoQatarRomaniaRussian FederationRwandaSamoaSan MarinoSao Tome and PrincipeSaudi ArabiaSenegalSerbiaSeychellesSierra LeoneSingaporeSint Maarten (Dutch part)Slovak RepublicSloveniaSmall statesSolomon IslandsSomaliaSouth AfricaSouth AsiaSouth Asia (IDA & IBRD)SpainSri LankaSt. Kitts and NevisSt. LuciaSt. Vincent and the GrenadinesSub-Saharan Africa Sub-Saharan Africa (excluding high income)Sub-Saharan Africa (IDA & IBRD countries)SudanSurinameSwazilandSwedenSwitzerlandSyrian Arab RepublicTajikistanTanzaniaThailandTimor-LesteTogoTongaTrinidad and TobagoTunisiaTurkeyTurks and Caicos IslandsUgandaUkraineUnited Arab EmiratesUnited KingdomUnited StatesUpper middle incomeUruguayUzbekistanVanuatuVenezuela, RBVietnamWest Bank and GazaWorldYemen, Rep.ZambiaZimbabwe Timeline:
This timeline shows a graph from 1975 to 2016 of Ghana. No data until 1974. Number of actual observations by date: 30.
Source name:
World Development Indicators
Source organization:
United Nations Educational, Scientific, and Cultural Organization (UNESCO) Institute for Statistics.
Categories, topics:
Education, Gender
Last updated:
apr 23, 2017
Indicators value changes by year
Minimum:
18.743
jan 1, 2006
Maximum:
26.731
jan 1, 1988
At the date of observation
Value
Absolute change
Change from previous value
jan 1, 1975
22.014
+22.014
0.0%
jan 1, 1976
21.917
-0.097
-0.44%
jan 1, 1977
21.649
-0.268
-1.22%
jan 1, 1978
24.492
+2.843
13.13%
jan 1, 1979
21.942
-2.549
-10.41%
jan 1, 1980
22.281
+0.339
1.54%
jan 1, 1981
21.275
-1.006
-4.51%
jan 1, 1982
21.039
-0.236
-1.11%
jan 1, 1983
22.193
+1.154
5.48%
jan 1, 1984
21.392
-0.8
-3.61%
jan 1, 1985
20.913
-0.479
-2.24%
jan 1, 1987
25.784
+4.871
23.29%
jan 1, 1988
26.731
+0.946
3.67%
jan 1, 1989
23.373
-3.358
-12.56%
jan 1, 1991
21.602
-1.771
-7.58%
jan 1, 2000
22.223
+0.62
2.87%
jan 1, 2001
22.319
+0.097
0.43%
jan 1, 2002
22.674
+0.354
1.59%
jan 1, 2003
21.024
-1.65
-7.28%
jan 1, 2004
20.694
-0.329
-1.57%
jan 1, 2005
24.146
+3.451
16.68%
jan 1, 2006
18.743
-5.403
-22.38%
jan 1, 2008
23.625
+4.882
26.05%
jan 1, 2009
22.08
-1.546
-6.54%
jan 1, 2010
22.263
+0.184
0.83%
jan 1, 2012
24.162
+1.899
8.53%
jan 1, 2013
24.511
+0.349
1.45%
jan 1, 2014
24.246
-0.265
-1.08%
jan 1, 2015
24.346
+0.099
0.41%
jan 1, 2016
24.395
+0.05
0.2%
Ranking of countries by current statistics by years


Comments: