30
/
AIzaSyAYiBZKx7MnpbEhh9jyipgxe19OcubqV5w
April 1, 2024
169022
Kiribati
KIR
true
2
1
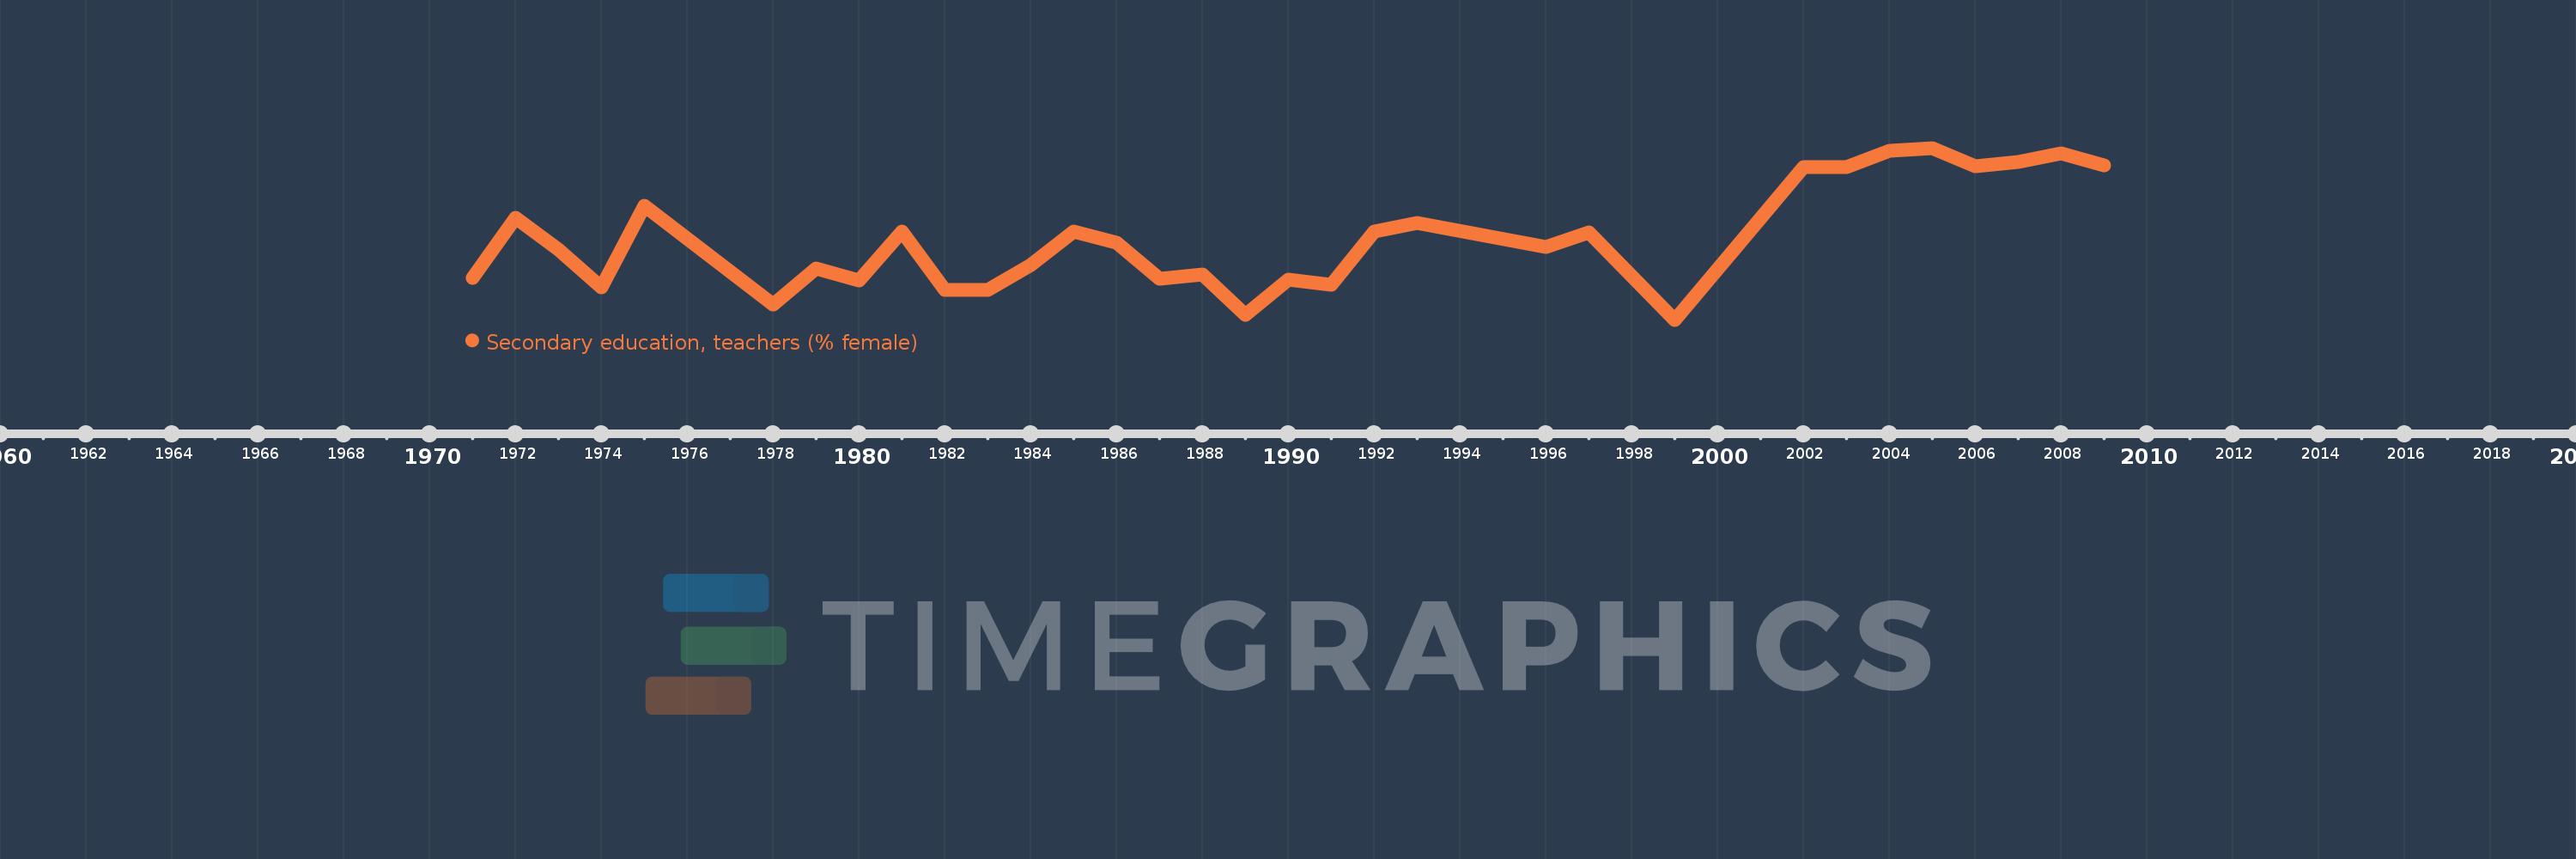
Secondary education, teachers (% female)
2009,2008,2007,2006,2005,2004,2003,2002,1999,1997,1996,1993,1992,1991,1990,1989,1988,1987,1986,1985,1984,1983,1982,1981,1980,1979,1978,1975,1974,1973,1972,1971
