29
/
en
AIzaSyAYiBZKx7MnpbEhh9jyipgxe19OcubqV5w
April 1, 2024
45662
Low & middle income
LMY
false
2
1
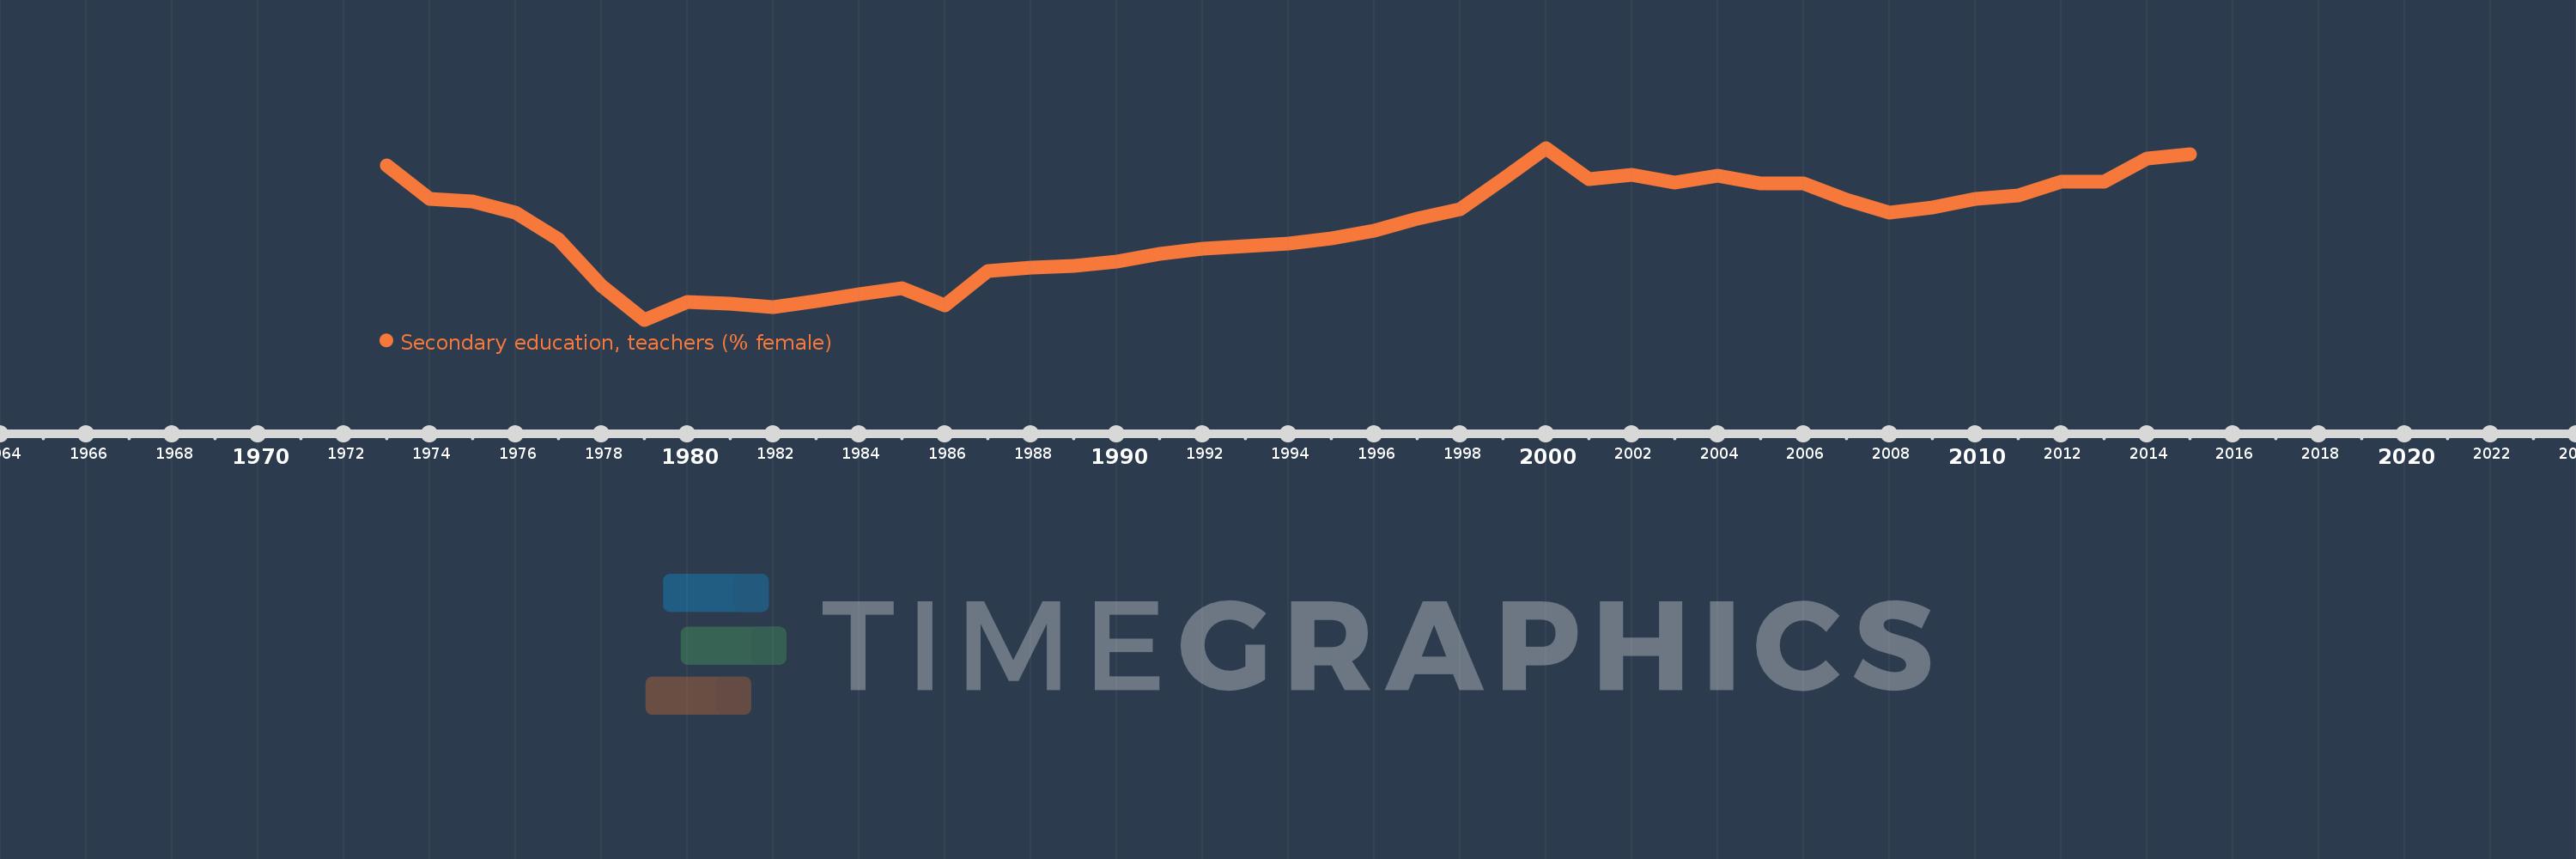
Secondary education, teachers (% female)
2015,2014,2013,2012,2011,2010,2009,2008,2007,2006,2005,2004,2003,2002,2001,2000,1999,1998,1997,1996,1995,1994,1993,1992,1991,1990,1989,1988,1987,1986,1985,1984,1983,1982,1981,1980,1979,1978,1977,1976,1975,1974,1973
This statistics in other country:
AfghanistanAlbaniaAlgeriaAndorraAngolaAntigua and BarbudaArab WorldArgentinaArmeniaArubaAustraliaAustriaBahamas, TheBahrainBangladeshBarbadosBelarusBelgiumBelizeBeninBermudaBhutanBoliviaBosnia and HerzegovinaBotswanaBrazilBritish Virgin IslandsBrunei DarussalamBulgariaBurkina FasoBurundiCabo VerdeCambodiaCameroonCanadaCaribbean small statesCayman IslandsCentral African RepublicCentral Europe and the BalticsChadChileChinaColombiaComorosCongo, Dem. Rep.Congo, Rep.Costa RicaCote d'IvoireCroatiaCubaCyprusCzech RepublicDenmarkDjiboutiDominicaDominican RepublicEarly-demographic dividendEast Asia & PacificEast Asia & Pacific (excluding high income)East Asia & Pacific (IDA & IBRD countries)EcuadorEgypt, Arab Rep.El SalvadorEquatorial GuineaEritreaEstoniaEthiopiaEuro areaEurope & Central AsiaEurope & Central Asia (excluding high income)Europe & Central Asia (IDA & IBRD countries)European UnionFijiFinlandFragile and conflict affected situationsFranceGabonGambia, TheGeorgiaGermanyGhanaGibraltarGreeceGrenadaGuatemalaGuineaGuinea-BissauGuyanaHeavily indebted poor countries (HIPC)High incomeHondurasHong Kong SAR, ChinaHungaryIBRD onlyIcelandIDA & IBRD totalIDA blendIDA onlyIDA totalIndiaIndonesiaIran, Islamic Rep.IraqIrelandIsraelItalyJamaicaJapanJordanKazakhstanKenyaKiribatiKorea, Dem. People’s Rep.Korea, Rep.KuwaitKyrgyz RepublicLao PDRLate-demographic dividendLatin America & Caribbean Latin America & Caribbean (excluding high income)Latin America & the Caribbean (IDA & IBRD countries)LatviaLeast developed countries: UN classificationLebanonLesothoLiberiaLibyaLiechtensteinLithuaniaLow & middle incomeLow incomeLower middle incomeLuxembourgMacao SAR, ChinaMacedonia, FYRMadagascarMalawiMalaysiaMaldivesMaliMaltaMarshall IslandsMauritaniaMauritiusMexicoMiddle East & North AfricaMiddle East & North Africa (excluding high income)Middle East & North Africa (IDA & IBRD countries)Middle incomeMoldovaMonacoMongoliaMoroccoMozambiqueMyanmarNamibiaNauruNepalNetherlandsNew ZealandNicaraguaNigerNigeriaNorth AmericaNorwayOECD membersOmanOther small statesPacific island small statesPakistanPalauPanamaPapua New GuineaParaguayPeruPhilippinesPolandPortugalPost-demographic dividendPre-demographic dividendPuerto RicoQatarRomaniaRussian FederationRwandaSamoaSan MarinoSao Tome and PrincipeSaudi ArabiaSenegalSerbiaSeychellesSierra LeoneSingaporeSint Maarten (Dutch part)Slovak RepublicSloveniaSmall statesSolomon IslandsSomaliaSouth AfricaSouth AsiaSouth Asia (IDA & IBRD)SpainSri LankaSt. Kitts and NevisSt. LuciaSt. Vincent and the GrenadinesSub-Saharan Africa Sub-Saharan Africa (excluding high income)Sub-Saharan Africa (IDA & IBRD countries)SudanSurinameSwazilandSwedenSwitzerlandSyrian Arab RepublicTajikistanTanzaniaThailandTimor-LesteTogoTongaTrinidad and TobagoTunisiaTurkeyTurks and Caicos IslandsUgandaUkraineUnited Arab EmiratesUnited KingdomUnited StatesUpper middle incomeUruguayUzbekistanVanuatuVenezuela, RBVietnamWest Bank and GazaWorldYemen, Rep.ZambiaZimbabwe Timeline:
This timeline shows a graph from 1973 to 2015 of Low & middle income. No data until 1972. Number of actual observations by date: 43.
Source name:
World Development Indicators
Source organization:
United Nations Educational, Scientific, and Cultural Organization (UNESCO) Institute for Statistics.
Categories, topics:
Education, Gender
Last updated:
apr 23, 2017
Indicators value changes by year
Maximum:
51.419
jan 1, 2000
At the date of observation
Value
Absolute change
Change from previous value
jan 1, 1973
50.771
+50.771
0.0%
jan 1, 1974
49.522
-1.248
-2.46%
jan 1, 1975
49.438
-0.085
-0.17%
jan 1, 1976
49.035
-0.403
-0.82%
jan 1, 1977
48.034
-1.001
-2.04%
jan 1, 1978
46.316
-1.718
-3.58%
jan 1, 1979
45.06
-1.255
-2.71%
jan 1, 1980
45.714
+0.653
1.45%
jan 1, 1981
45.659
-0.055
-0.12%
jan 1, 1982
45.543
-0.116
-0.25%
jan 1, 1983
45.739
+0.195
0.43%
jan 1, 1984
46.02
+0.282
0.62%
jan 1, 1985
46.24
+0.219
0.48%
jan 1, 1986
45.586
-0.653
-1.41%
jan 1, 1987
46.857
+1.27
2.79%
jan 1, 1988
46.98
+0.123
0.26%
jan 1, 1989
47.056
+0.076
0.16%
jan 1, 1990
47.219
+0.164
0.35%
jan 1, 1991
47.507
+0.288
0.61%
jan 1, 1992
47.677
+0.17
0.36%
jan 1, 1993
47.781
+0.103
0.22%
jan 1, 1994
47.868
+0.087
0.18%
jan 1, 1995
48.07
+0.202
0.42%
jan 1, 1996
48.352
+0.282
0.59%
jan 1, 1997
48.796
+0.444
0.92%
jan 1, 1998
49.147
+0.351
0.72%
jan 1, 1999
50.257
+1.11
2.26%
jan 1, 2000
51.419
+1.161
2.31%
jan 1, 2001
50.278
-1.141
-2.22%
jan 1, 2002
50.412
+0.134
0.27%
jan 1, 2003
50.138
-0.274
-0.54%
jan 1, 2004
50.385
+0.247
0.49%
jan 1, 2005
50.12
-0.265
-0.53%
jan 1, 2006
50.099
-0.021
-0.04%
jan 1, 2007
49.489
-0.61
-1.22%
jan 1, 2008
49.035
-0.454
-0.92%
jan 1, 2009
49.216
+0.181
0.37%
jan 1, 2010
49.53
+0.313
0.64%
jan 1, 2011
49.665
+0.136
0.27%
jan 1, 2012
50.175
+0.51
1.03%
jan 1, 2013
50.167
-0.008
-0.02%
jan 1, 2014
51.016
+0.849
1.69%
jan 1, 2015
51.19
+0.174
0.34%
Ranking of countries by current statistics by years


Comments: