29
/
en
AIzaSyAYiBZKx7MnpbEhh9jyipgxe19OcubqV5w
April 1, 2024
37786
IDA & IBRD total
IBT
false
2
1
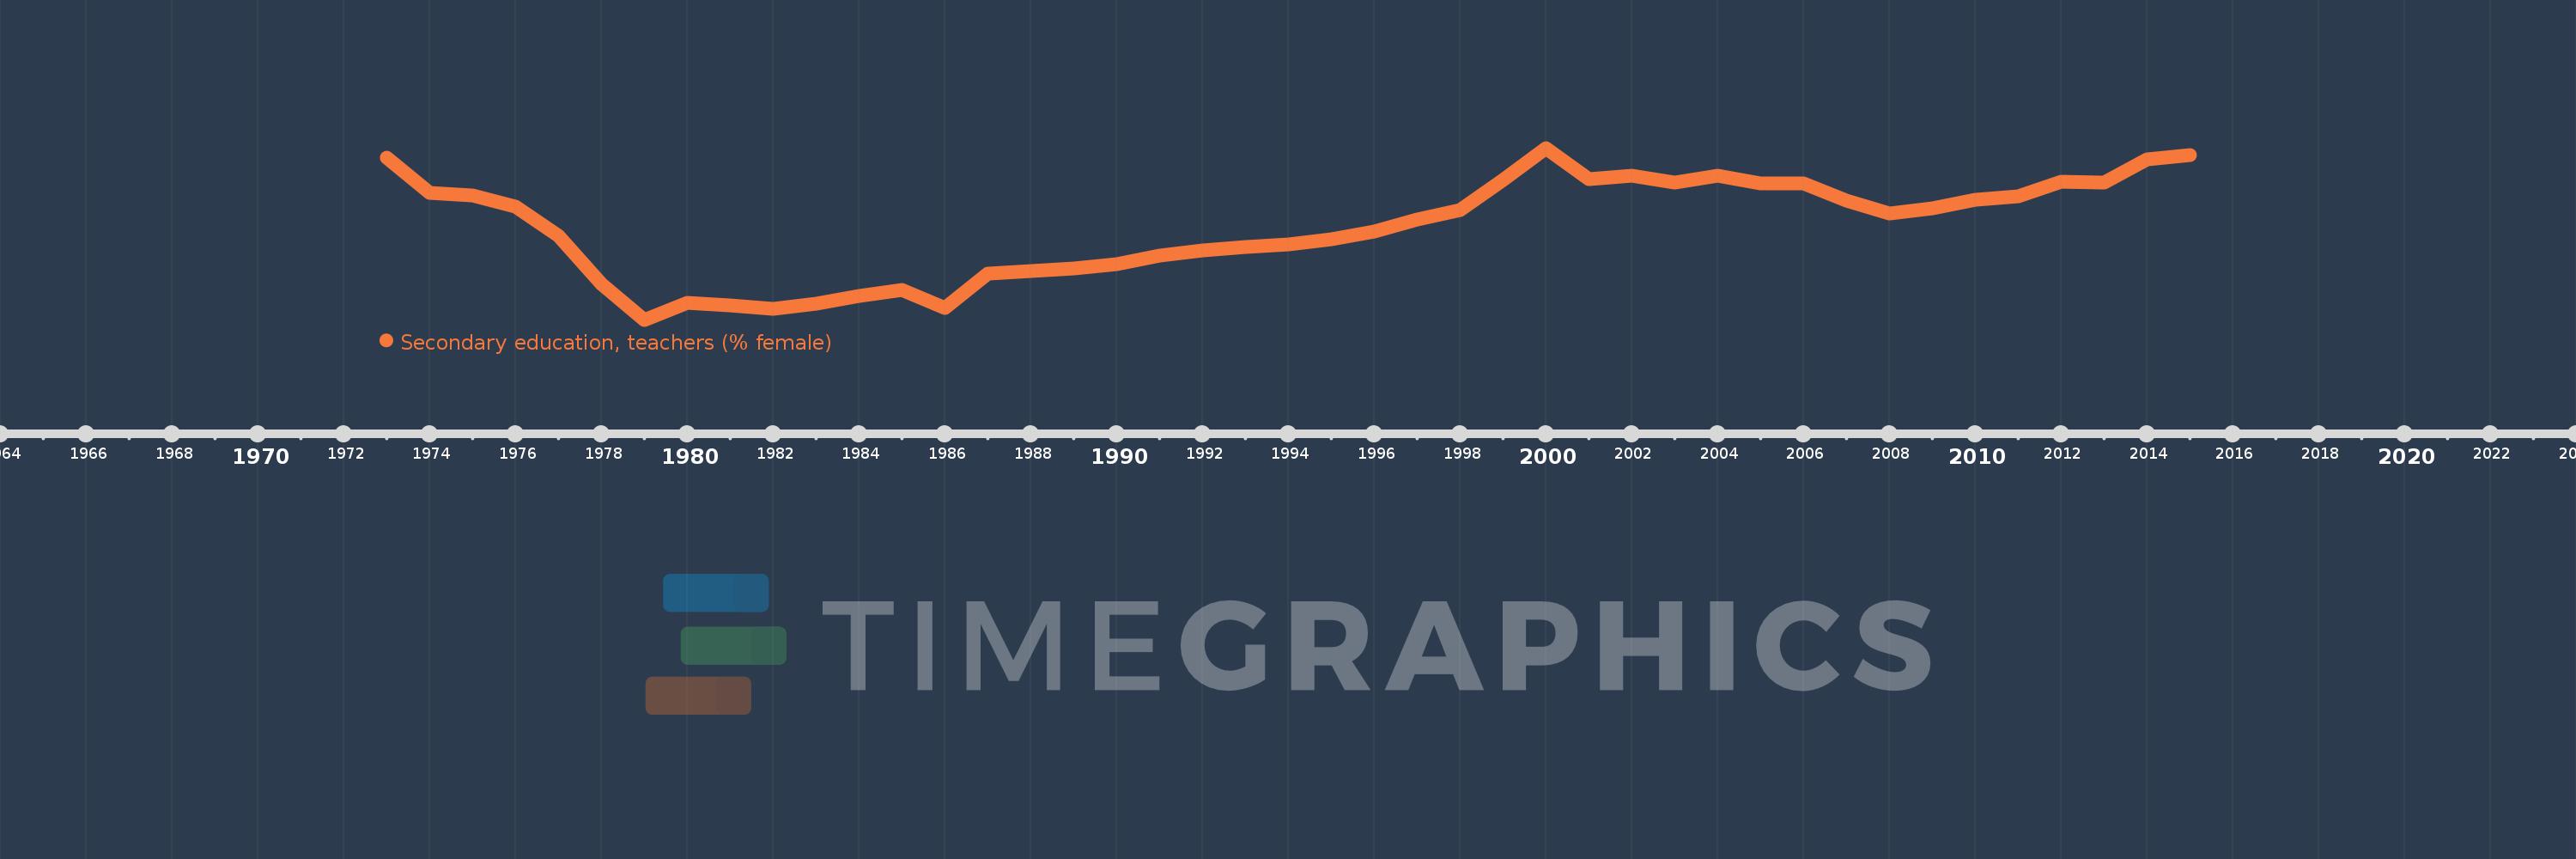
Secondary education, teachers (% female)
2015,2014,2013,2012,2011,2010,2009,2008,2007,2006,2005,2004,2003,2002,2001,2000,1999,1998,1997,1996,1995,1994,1993,1992,1991,1990,1989,1988,1987,1986,1985,1984,1983,1982,1981,1980,1979,1978,1977,1976,1975,1974,1973
This statistics in other country:
AfghanistanAlbaniaAlgeriaAndorraAngolaAntigua and BarbudaArab WorldArgentinaArmeniaArubaAustraliaAustriaBahamas, TheBahrainBangladeshBarbadosBelarusBelgiumBelizeBeninBermudaBhutanBoliviaBosnia and HerzegovinaBotswanaBrazilBritish Virgin IslandsBrunei DarussalamBulgariaBurkina FasoBurundiCabo VerdeCambodiaCameroonCanadaCaribbean small statesCayman IslandsCentral African RepublicCentral Europe and the BalticsChadChileChinaColombiaComorosCongo, Dem. Rep.Congo, Rep.Costa RicaCote d'IvoireCroatiaCubaCyprusCzech RepublicDenmarkDjiboutiDominicaDominican RepublicEarly-demographic dividendEast Asia & PacificEast Asia & Pacific (excluding high income)East Asia & Pacific (IDA & IBRD countries)EcuadorEgypt, Arab Rep.El SalvadorEquatorial GuineaEritreaEstoniaEthiopiaEuro areaEurope & Central AsiaEurope & Central Asia (excluding high income)Europe & Central Asia (IDA & IBRD countries)European UnionFijiFinlandFragile and conflict affected situationsFranceGabonGambia, TheGeorgiaGermanyGhanaGibraltarGreeceGrenadaGuatemalaGuineaGuinea-BissauGuyanaHeavily indebted poor countries (HIPC)High incomeHondurasHong Kong SAR, ChinaHungaryIBRD onlyIcelandIDA & IBRD totalIDA blendIDA onlyIDA totalIndiaIndonesiaIran, Islamic Rep.IraqIrelandIsraelItalyJamaicaJapanJordanKazakhstanKenyaKiribatiKorea, Dem. People’s Rep.Korea, Rep.KuwaitKyrgyz RepublicLao PDRLate-demographic dividendLatin America & Caribbean Latin America & Caribbean (excluding high income)Latin America & the Caribbean (IDA & IBRD countries)LatviaLeast developed countries: UN classificationLebanonLesothoLiberiaLibyaLiechtensteinLithuaniaLow & middle incomeLow incomeLower middle incomeLuxembourgMacao SAR, ChinaMacedonia, FYRMadagascarMalawiMalaysiaMaldivesMaliMaltaMarshall IslandsMauritaniaMauritiusMexicoMiddle East & North AfricaMiddle East & North Africa (excluding high income)Middle East & North Africa (IDA & IBRD countries)Middle incomeMoldovaMonacoMongoliaMoroccoMozambiqueMyanmarNamibiaNauruNepalNetherlandsNew ZealandNicaraguaNigerNigeriaNorth AmericaNorwayOECD membersOmanOther small statesPacific island small statesPakistanPalauPanamaPapua New GuineaParaguayPeruPhilippinesPolandPortugalPost-demographic dividendPre-demographic dividendPuerto RicoQatarRomaniaRussian FederationRwandaSamoaSan MarinoSao Tome and PrincipeSaudi ArabiaSenegalSerbiaSeychellesSierra LeoneSingaporeSint Maarten (Dutch part)Slovak RepublicSloveniaSmall statesSolomon IslandsSomaliaSouth AfricaSouth AsiaSouth Asia (IDA & IBRD)SpainSri LankaSt. Kitts and NevisSt. LuciaSt. Vincent and the GrenadinesSub-Saharan Africa Sub-Saharan Africa (excluding high income)Sub-Saharan Africa (IDA & IBRD countries)SudanSurinameSwazilandSwedenSwitzerlandSyrian Arab RepublicTajikistanTanzaniaThailandTimor-LesteTogoTongaTrinidad and TobagoTunisiaTurkeyTurks and Caicos IslandsUgandaUkraineUnited Arab EmiratesUnited KingdomUnited StatesUpper middle incomeUruguayUzbekistanVanuatuVenezuela, RBVietnamWest Bank and GazaWorldYemen, Rep.ZambiaZimbabwe Timeline:
This timeline shows a graph from 1973 to 2015 of IDA & IBRD total. No data until 1972. Number of actual observations by date: 43.
Source name:
World Development Indicators
Source organization:
United Nations Educational, Scientific, and Cultural Organization (UNESCO) Institute for Statistics.
Categories, topics:
Education, Gender
Last updated:
apr 23, 2017
Indicators value changes by year
Minimum:
45.539
jan 1, 1979
Maximum:
51.698
jan 1, 2000
At the date of observation
Value
Absolute change
Change from previous value
jan 1, 1973
51.353
+51.353
0.0%
jan 1, 1974
50.099
-1.253
-2.44%
jan 1, 1975
49.999
-0.1
-0.2%
jan 1, 1976
49.586
-0.413
-0.83%
jan 1, 1977
48.563
-1.023
-2.06%
jan 1, 1978
46.824
-1.739
-3.58%
jan 1, 1979
45.539
-1.285
-2.74%
jan 1, 1980
46.134
+0.595
1.31%
jan 1, 1981
46.063
-0.071
-0.15%
jan 1, 1982
45.933
-0.13
-0.28%
jan 1, 1983
46.12
+0.187
0.41%
jan 1, 1984
46.388
+0.268
0.58%
jan 1, 1985
46.604
+0.216
0.47%
jan 1, 1986
45.949
-0.656
-1.41%
jan 1, 1987
47.188
+1.24
2.7%
jan 1, 1988
47.291
+0.102
0.22%
jan 1, 1989
47.372
+0.082
0.17%
jan 1, 1990
47.537
+0.165
0.35%
jan 1, 1991
47.835
+0.298
0.63%
jan 1, 1992
48.012
+0.176
0.37%
jan 1, 1993
48.144
+0.132
0.27%
jan 1, 1994
48.227
+0.084
0.17%
jan 1, 1995
48.423
+0.196
0.41%
jan 1, 1996
48.694
+0.271
0.56%
jan 1, 1997
49.121
+0.427
0.88%
jan 1, 1998
49.46
+0.339
0.69%
jan 1, 1999
50.554
+1.094
2.21%
jan 1, 2000
51.698
+1.144
2.26%
jan 1, 2001
50.573
-1.125
-2.18%
jan 1, 2002
50.7
+0.127
0.25%
jan 1, 2003
50.442
-0.257
-0.51%
jan 1, 2004
50.703
+0.26
0.52%
jan 1, 2005
50.431
-0.272
-0.54%
jan 1, 2006
50.425
-0.006
-0.01%
jan 1, 2007
49.806
-0.619
-1.23%
jan 1, 2008
49.353
-0.452
-0.91%
jan 1, 2009
49.522
+0.169
0.34%
jan 1, 2010
49.827
+0.305
0.62%
jan 1, 2011
49.95
+0.122
0.25%
jan 1, 2012
50.48
+0.531
1.06%
jan 1, 2013
50.458
-0.022
-0.04%
jan 1, 2014
51.282
+0.824
1.63%
jan 1, 2015
51.433
+0.151
0.29%
Ranking of countries by current statistics by years


Comments: