29
/
en
AIzaSyAYiBZKx7MnpbEhh9jyipgxe19OcubqV5w
April 1, 2024
55884
Pre-demographic dividend
PRE
false
2
1
Secondary education, teachers (% female)
2015,2014,2013,2012,2011,2010,2009,2008,2007,2006,2005,2004,2003,2002,2001,2000,1999,1998,1997,1996,1995,1994,1993,1992,1991,1990,1989,1988,1987,1986,1985,1984,1983,1982,1981,1980,1979,1978,1977,1976,1975,1974,1973,1972
This statistics in other country:
AfghanistanAlbaniaAlgeriaAndorraAngolaAntigua and BarbudaArab WorldArgentinaArmeniaArubaAustraliaAustriaBahamas, TheBahrainBangladeshBarbadosBelarusBelgiumBelizeBeninBermudaBhutanBoliviaBosnia and HerzegovinaBotswanaBrazilBritish Virgin IslandsBrunei DarussalamBulgariaBurkina FasoBurundiCabo VerdeCambodiaCameroonCanadaCaribbean small statesCayman IslandsCentral African RepublicCentral Europe and the BalticsChadChileChinaColombiaComorosCongo, Dem. Rep.Congo, Rep.Costa RicaCote d'IvoireCroatiaCubaCyprusCzech RepublicDenmarkDjiboutiDominicaDominican RepublicEarly-demographic dividendEast Asia & PacificEast Asia & Pacific (excluding high income)East Asia & Pacific (IDA & IBRD countries)EcuadorEgypt, Arab Rep.El SalvadorEquatorial GuineaEritreaEstoniaEthiopiaEuro areaEurope & Central AsiaEurope & Central Asia (excluding high income)Europe & Central Asia (IDA & IBRD countries)European UnionFijiFinlandFragile and conflict affected situationsFranceGabonGambia, TheGeorgiaGermanyGhanaGibraltarGreeceGrenadaGuatemalaGuineaGuinea-BissauGuyanaHeavily indebted poor countries (HIPC)High incomeHondurasHong Kong SAR, ChinaHungaryIBRD onlyIcelandIDA & IBRD totalIDA blendIDA onlyIDA totalIndiaIndonesiaIran, Islamic Rep.IraqIrelandIsraelItalyJamaicaJapanJordanKazakhstanKenyaKiribatiKorea, Dem. People’s Rep.Korea, Rep.KuwaitKyrgyz RepublicLao PDRLate-demographic dividendLatin America & Caribbean Latin America & Caribbean (excluding high income)Latin America & the Caribbean (IDA & IBRD countries)LatviaLeast developed countries: UN classificationLebanonLesothoLiberiaLibyaLiechtensteinLithuaniaLow & middle incomeLow incomeLower middle incomeLuxembourgMacao SAR, ChinaMacedonia, FYRMadagascarMalawiMalaysiaMaldivesMaliMaltaMarshall IslandsMauritaniaMauritiusMexicoMiddle East & North AfricaMiddle East & North Africa (excluding high income)Middle East & North Africa (IDA & IBRD countries)Middle incomeMoldovaMonacoMongoliaMoroccoMozambiqueMyanmarNamibiaNauruNepalNetherlandsNew ZealandNicaraguaNigerNigeriaNorth AmericaNorwayOECD membersOmanOther small statesPacific island small statesPakistanPalauPanamaPapua New GuineaParaguayPeruPhilippinesPolandPortugalPost-demographic dividendPre-demographic dividendPuerto RicoQatarRomaniaRussian FederationRwandaSamoaSan MarinoSao Tome and PrincipeSaudi ArabiaSenegalSerbiaSeychellesSierra LeoneSingaporeSint Maarten (Dutch part)Slovak RepublicSloveniaSmall statesSolomon IslandsSomaliaSouth AfricaSouth AsiaSouth Asia (IDA & IBRD)SpainSri LankaSt. Kitts and NevisSt. LuciaSt. Vincent and the GrenadinesSub-Saharan Africa Sub-Saharan Africa (excluding high income)Sub-Saharan Africa (IDA & IBRD countries)SudanSurinameSwazilandSwedenSwitzerlandSyrian Arab RepublicTajikistanTanzaniaThailandTimor-LesteTogoTongaTrinidad and TobagoTunisiaTurkeyTurks and Caicos IslandsUgandaUkraineUnited Arab EmiratesUnited KingdomUnited StatesUpper middle incomeUruguayUzbekistanVanuatuVenezuela, RBVietnamWest Bank and GazaWorldYemen, Rep.ZambiaZimbabwe Timeline:
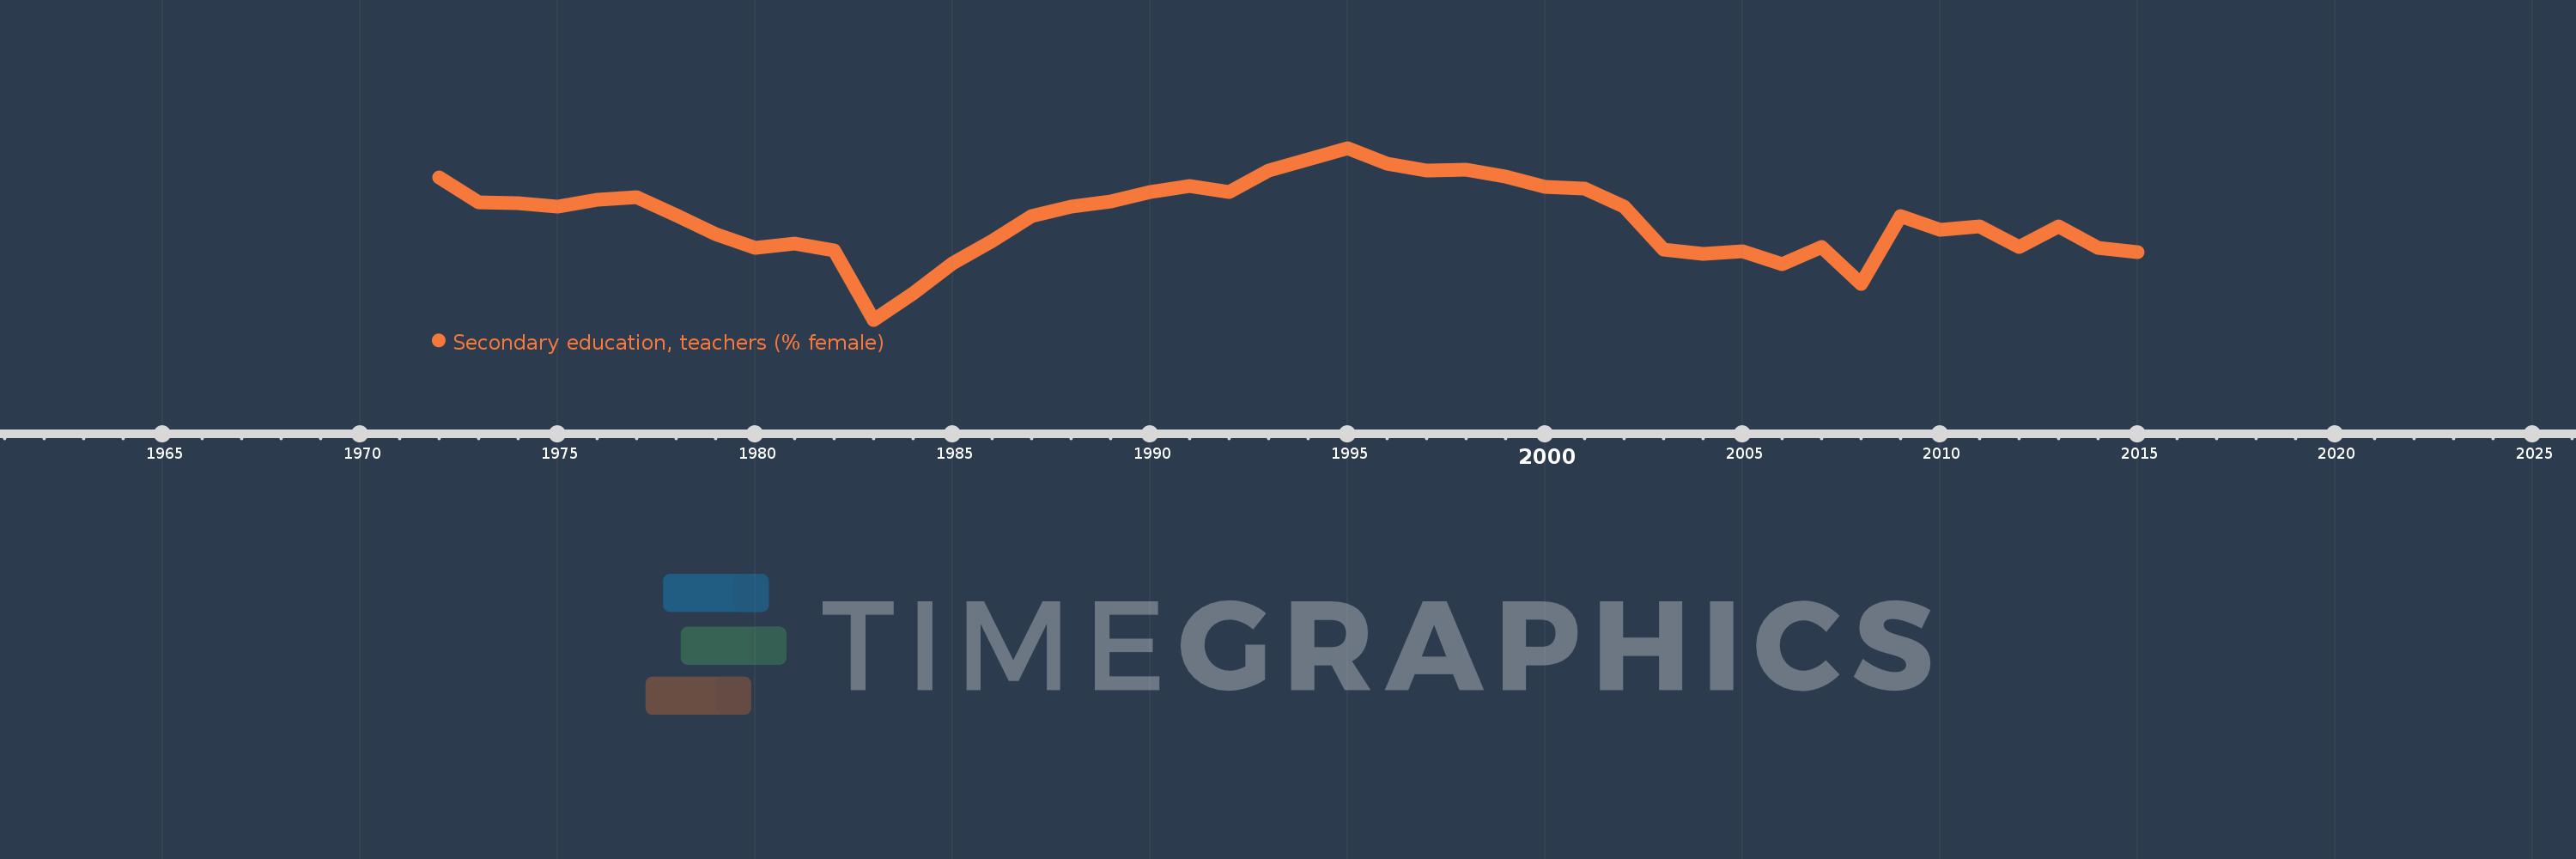
This timeline shows a graph from 1972 to 2015 of Pre-demographic dividend. No data until 1971. Number of actual observations by date: 44.
Source name:
World Development Indicators
Source organization:
United Nations Educational, Scientific, and Cultural Organization (UNESCO) Institute for Statistics.
Categories, topics:
Education, Gender
Last updated:
apr 23, 2017
Indicators value changes by year
Minimum:
27.145
jan 1, 1983
Maximum:
32.203
jan 1, 1995
At the date of observation
Value
Absolute change
Change from previous value
jan 1, 1972
31.346
+31.346
0.0%
jan 1, 1973
30.595
-0.751
-2.4%
jan 1, 1974
30.571
-0.024
-0.08%
jan 1, 1975
30.473
-0.098
-0.32%
jan 1, 1976
30.676
+0.204
0.67%
jan 1, 1977
30.761
+0.085
0.28%
jan 1, 1978
30.214
-0.547
-1.78%
jan 1, 1979
29.662
-0.552
-1.83%
jan 1, 1980
29.257
-0.405
-1.37%
jan 1, 1981
29.393
+0.136
0.47%
jan 1, 1982
29.184
-0.209
-0.71%
jan 1, 1983
27.145
-2.039
-6.99%
jan 1, 1984
27.909
+0.764
2.81%
jan 1, 1985
28.8
+0.891
3.19%
jan 1, 1986
29.472
+0.672
2.33%
jan 1, 1987
30.205
+0.732
2.48%
jan 1, 1988
30.466
+0.261
0.86%
jan 1, 1989
30.623
+0.158
0.52%
jan 1, 1990
30.906
+0.283
0.92%
jan 1, 1991
31.08
+0.174
0.56%
jan 1, 1992
30.911
-0.169
-0.54%
jan 1, 1993
31.54
+0.629
2.03%
jan 1, 1994
31.873
+0.333
1.05%
jan 1, 1995
32.203
+0.33
1.04%
jan 1, 1996
31.75
-0.453
-1.41%
jan 1, 1997
31.532
-0.219
-0.69%
jan 1, 1998
31.562
+0.03
0.1%
jan 1, 1999
31.357
-0.205
-0.65%
jan 1, 2000
31.069
-0.288
-0.92%
jan 1, 2001
31.016
-0.053
-0.17%
jan 1, 2002
30.478
-0.538
-1.73%
jan 1, 2003
29.204
-1.275
-4.18%
jan 1, 2004
29.091
-0.113
-0.39%
jan 1, 2005
29.164
+0.073
0.25%
jan 1, 2006
28.785
-0.38
-1.3%
jan 1, 2007
29.296
+0.511
1.78%
jan 1, 2008
28.204
-1.092
-3.73%
jan 1, 2009
30.205
+2.001
7.1%
jan 1, 2010
29.794
-0.412
-1.36%
jan 1, 2011
29.898
+0.104
0.35%
jan 1, 2012
29.278
-0.62
-2.07%
jan 1, 2013
29.901
+0.624
2.13%
jan 1, 2014
29.259
-0.642
-2.15%
jan 1, 2015
29.124
-0.136
-0.46%
Ranking of countries by current statistics by years


Comments: