29
/
en
AIzaSyAYiBZKx7MnpbEhh9jyipgxe19OcubqV5w
April 1, 2024
60369
Sub-Saharan Africa (excluding high income)
SSA
false
2
1
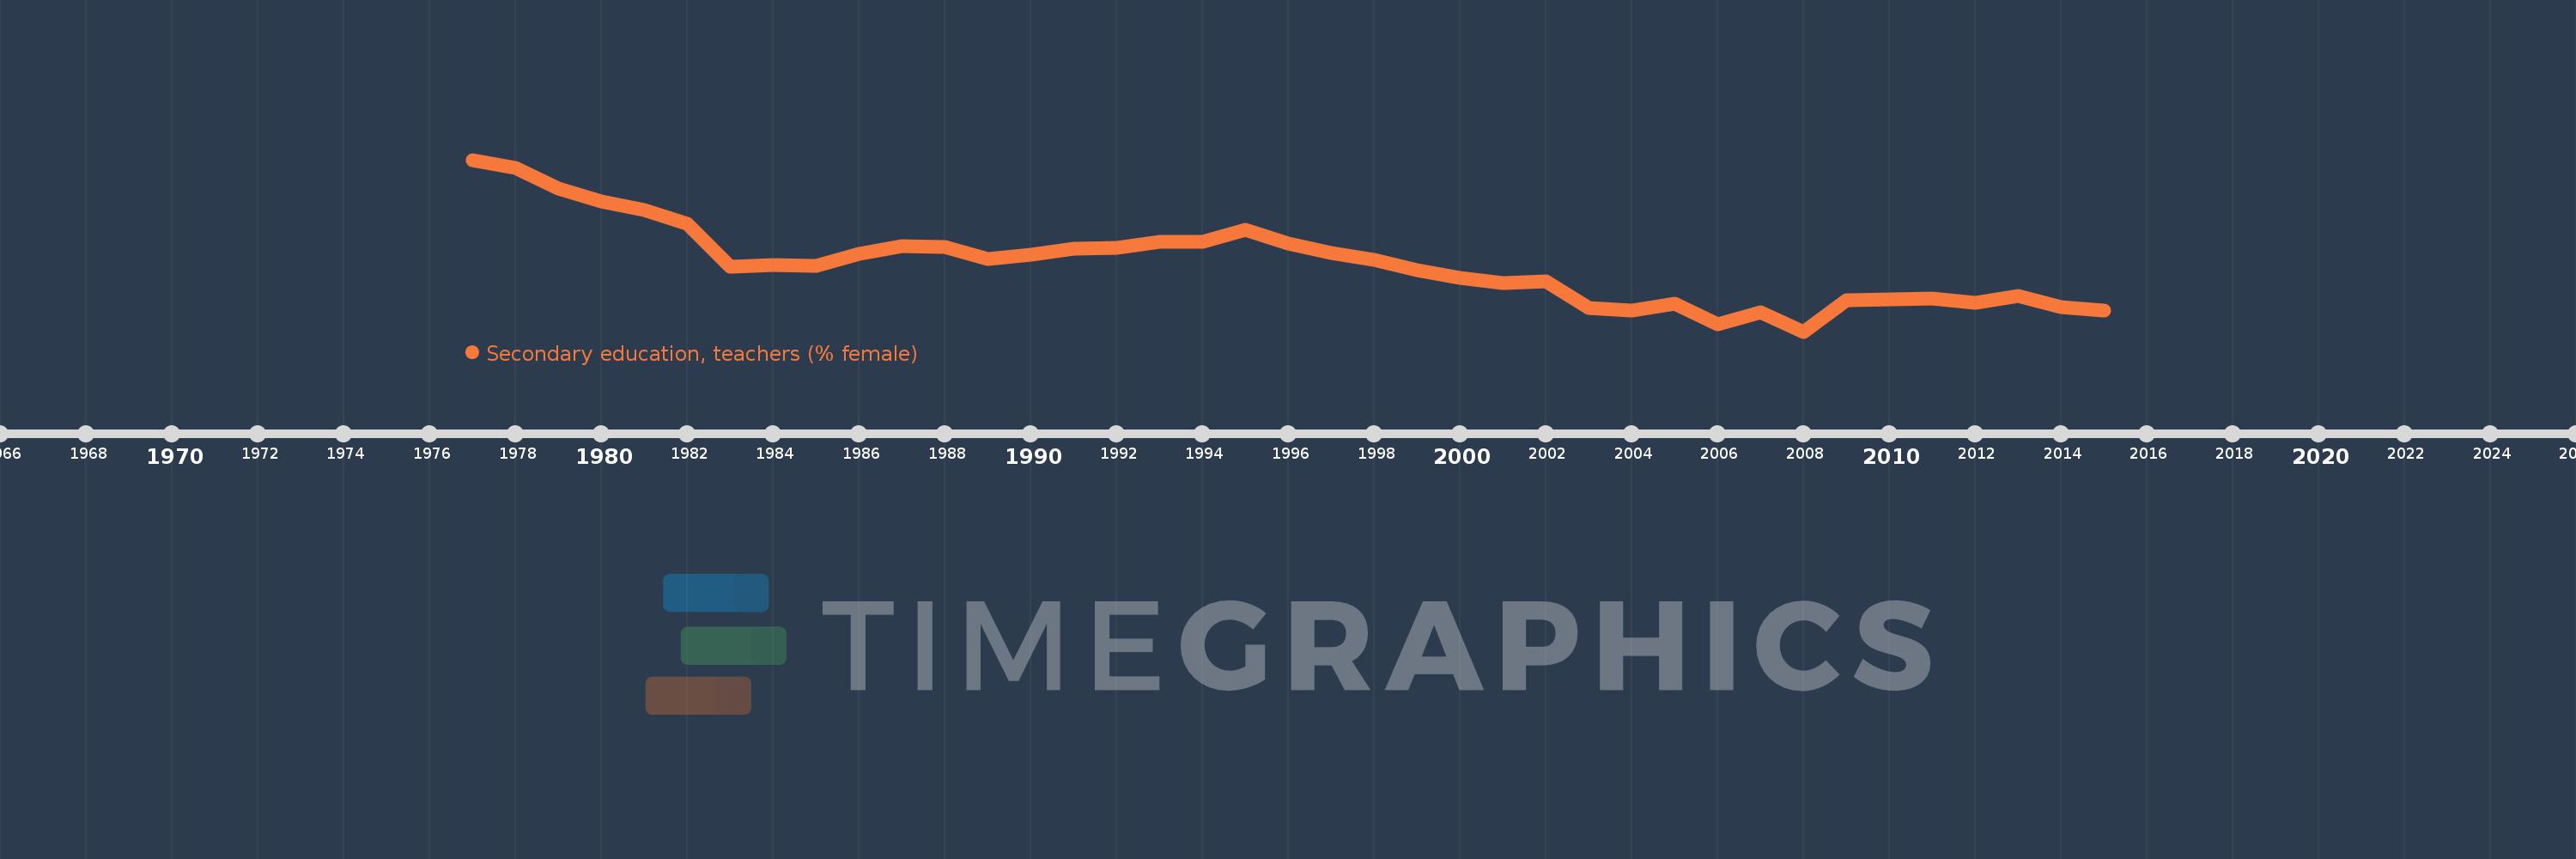
Secondary education, teachers (% female)
2015,2014,2013,2012,2011,2010,2009,2008,2007,2006,2005,2004,2003,2002,2001,2000,1999,1998,1997,1996,1995,1994,1993,1992,1991,1990,1989,1988,1987,1986,1985,1984,1983,1982,1981,1980,1979,1978,1977
This statistics in other country:
AfghanistanAlbaniaAlgeriaAndorraAngolaAntigua and BarbudaArab WorldArgentinaArmeniaArubaAustraliaAustriaBahamas, TheBahrainBangladeshBarbadosBelarusBelgiumBelizeBeninBermudaBhutanBoliviaBosnia and HerzegovinaBotswanaBrazilBritish Virgin IslandsBrunei DarussalamBulgariaBurkina FasoBurundiCabo VerdeCambodiaCameroonCanadaCaribbean small statesCayman IslandsCentral African RepublicCentral Europe and the BalticsChadChileChinaColombiaComorosCongo, Dem. Rep.Congo, Rep.Costa RicaCote d'IvoireCroatiaCubaCyprusCzech RepublicDenmarkDjiboutiDominicaDominican RepublicEarly-demographic dividendEast Asia & PacificEast Asia & Pacific (excluding high income)East Asia & Pacific (IDA & IBRD countries)EcuadorEgypt, Arab Rep.El SalvadorEquatorial GuineaEritreaEstoniaEthiopiaEuro areaEurope & Central AsiaEurope & Central Asia (excluding high income)Europe & Central Asia (IDA & IBRD countries)European UnionFijiFinlandFragile and conflict affected situationsFranceGabonGambia, TheGeorgiaGermanyGhanaGibraltarGreeceGrenadaGuatemalaGuineaGuinea-BissauGuyanaHeavily indebted poor countries (HIPC)High incomeHondurasHong Kong SAR, ChinaHungaryIBRD onlyIcelandIDA & IBRD totalIDA blendIDA onlyIDA totalIndiaIndonesiaIran, Islamic Rep.IraqIrelandIsraelItalyJamaicaJapanJordanKazakhstanKenyaKiribatiKorea, Dem. People’s Rep.Korea, Rep.KuwaitKyrgyz RepublicLao PDRLate-demographic dividendLatin America & Caribbean Latin America & Caribbean (excluding high income)Latin America & the Caribbean (IDA & IBRD countries)LatviaLeast developed countries: UN classificationLebanonLesothoLiberiaLibyaLiechtensteinLithuaniaLow & middle incomeLow incomeLower middle incomeLuxembourgMacao SAR, ChinaMacedonia, FYRMadagascarMalawiMalaysiaMaldivesMaliMaltaMarshall IslandsMauritaniaMauritiusMexicoMiddle East & North AfricaMiddle East & North Africa (excluding high income)Middle East & North Africa (IDA & IBRD countries)Middle incomeMoldovaMonacoMongoliaMoroccoMozambiqueMyanmarNamibiaNauruNepalNetherlandsNew ZealandNicaraguaNigerNigeriaNorth AmericaNorwayOECD membersOmanOther small statesPacific island small statesPakistanPalauPanamaPapua New GuineaParaguayPeruPhilippinesPolandPortugalPost-demographic dividendPre-demographic dividendPuerto RicoQatarRomaniaRussian FederationRwandaSamoaSan MarinoSao Tome and PrincipeSaudi ArabiaSenegalSerbiaSeychellesSierra LeoneSingaporeSint Maarten (Dutch part)Slovak RepublicSloveniaSmall statesSolomon IslandsSomaliaSouth AfricaSouth AsiaSouth Asia (IDA & IBRD)SpainSri LankaSt. Kitts and NevisSt. LuciaSt. Vincent and the GrenadinesSub-Saharan Africa Sub-Saharan Africa (excluding high income)Sub-Saharan Africa (IDA & IBRD countries)SudanSurinameSwazilandSwedenSwitzerlandSyrian Arab RepublicTajikistanTanzaniaThailandTimor-LesteTogoTongaTrinidad and TobagoTunisiaTurkeyTurks and Caicos IslandsUgandaUkraineUnited Arab EmiratesUnited KingdomUnited StatesUpper middle incomeUruguayUzbekistanVanuatuVenezuela, RBVietnamWest Bank and GazaWorldYemen, Rep.ZambiaZimbabwe Timeline:
This timeline shows a graph from 1977 to 2015 of Sub-Saharan Africa (excluding high income). No data until 1976. Number of actual observations by date: 39.
Source name:
World Development Indicators
Source organization:
United Nations Educational, Scientific, and Cultural Organization (UNESCO) Institute for Statistics.
Categories, topics:
Education, Gender
Last updated:
apr 23, 2017
Indicators value changes by year
Minimum:
28.485
jan 1, 2008
Maximum:
37.558
jan 1, 1977
At the date of observation
Value
Absolute change
Change from previous value
jan 1, 1977
37.558
+37.558
0.0%
jan 1, 1978
37.109
-0.449
-1.2%
jan 1, 1979
36.054
-1.055
-2.84%
jan 1, 1980
35.339
-0.715
-1.98%
jan 1, 1981
34.891
-0.448
-1.27%
jan 1, 1982
34.178
-0.713
-2.04%
jan 1, 1983
31.932
-2.246
-6.57%
jan 1, 1984
31.999
+0.067
0.21%
jan 1, 1985
31.945
-0.053
-0.17%
jan 1, 1986
32.608
+0.663
2.08%
jan 1, 1987
32.989
+0.381
1.17%
jan 1, 1988
32.943
-0.046
-0.14%
jan 1, 1989
32.309
-0.634
-1.92%
jan 1, 1990
32.551
+0.242
0.75%
jan 1, 1991
32.88
+0.329
1.01%
jan 1, 1992
32.895
+0.015
0.05%
jan 1, 1993
33.219
+0.324
0.98%
jan 1, 1994
33.236
+0.017
0.05%
jan 1, 1995
33.876
+0.64
1.93%
jan 1, 1996
33.151
-0.725
-2.14%
jan 1, 1997
32.653
-0.498
-1.5%
jan 1, 1998
32.255
-0.397
-1.22%
jan 1, 1999
31.707
-0.548
-1.7%
jan 1, 2000
31.322
-0.385
-1.21%
jan 1, 2001
31.063
-0.259
-0.83%
jan 1, 2002
31.144
+0.081
0.26%
jan 1, 2003
29.726
-1.418
-4.55%
jan 1, 2004
29.601
-0.124
-0.42%
jan 1, 2005
29.969
+0.368
1.24%
jan 1, 2006
28.866
-1.103
-3.68%
jan 1, 2007
29.507
+0.64
2.22%
jan 1, 2008
28.485
-1.022
-3.46%
jan 1, 2009
30.132
+1.646
5.78%
jan 1, 2010
30.168
+0.037
0.12%
jan 1, 2011
30.239
+0.071
0.24%
jan 1, 2012
29.994
-0.245
-0.81%
jan 1, 2013
30.368
+0.374
1.25%
jan 1, 2014
29.794
-0.573
-1.89%
jan 1, 2015
29.588
-0.206
-0.69%
Ranking of countries by current statistics by years


Comments: