30
/
AIzaSyAYiBZKx7MnpbEhh9jyipgxe19OcubqV5w
April 1, 2024
107979
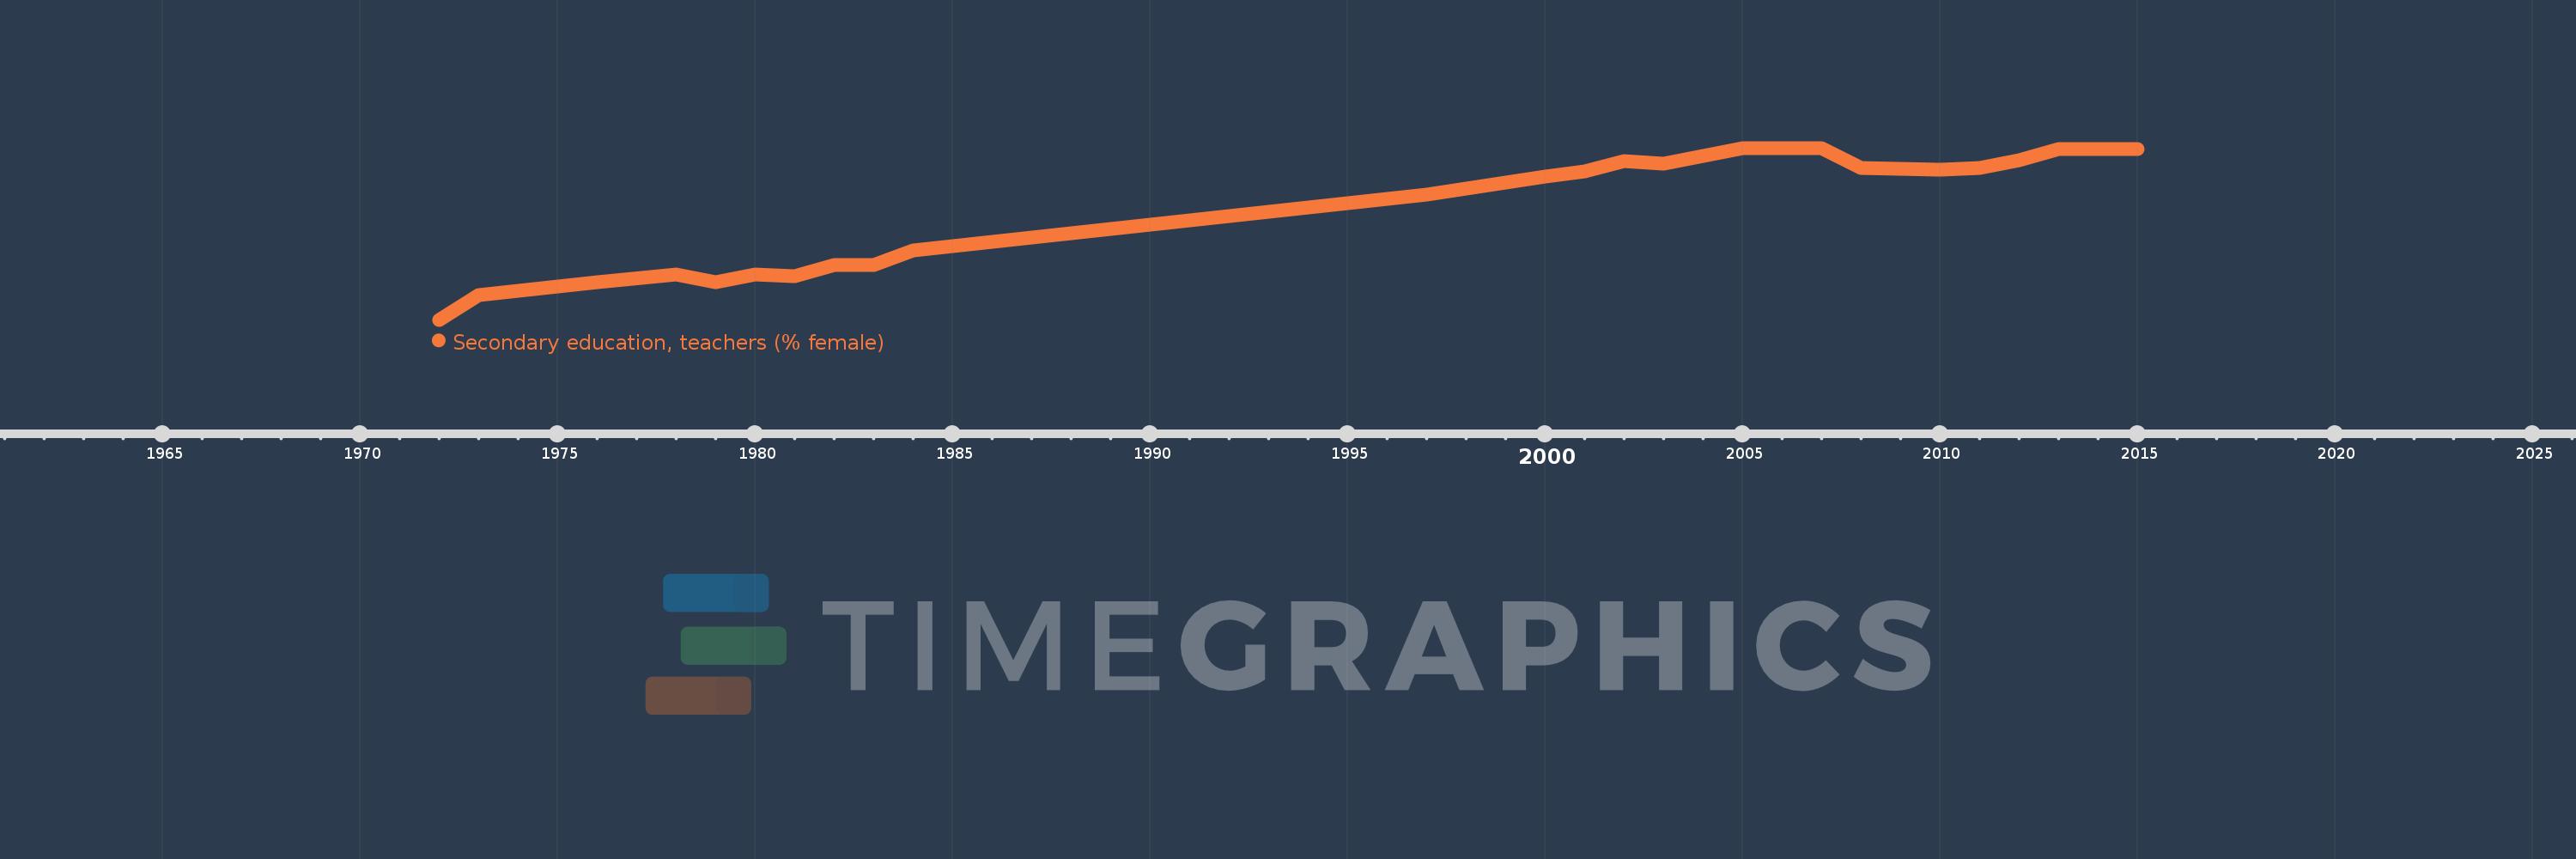
Colombia
COL
true
2
1
Secondary education, teachers (% female)
2015,2014,2013,2012,2011,2010,2008,2007,2006,2005,2003,2002,2001,2000,1997,1984,1983,1982,1981,1980,1979,1978,1976,1973,1972
