29
/
en
AIzaSyAYiBZKx7MnpbEhh9jyipgxe19OcubqV5w
April 1, 2024
125516
Egypt, Arab Rep.
EGY
true
2
1
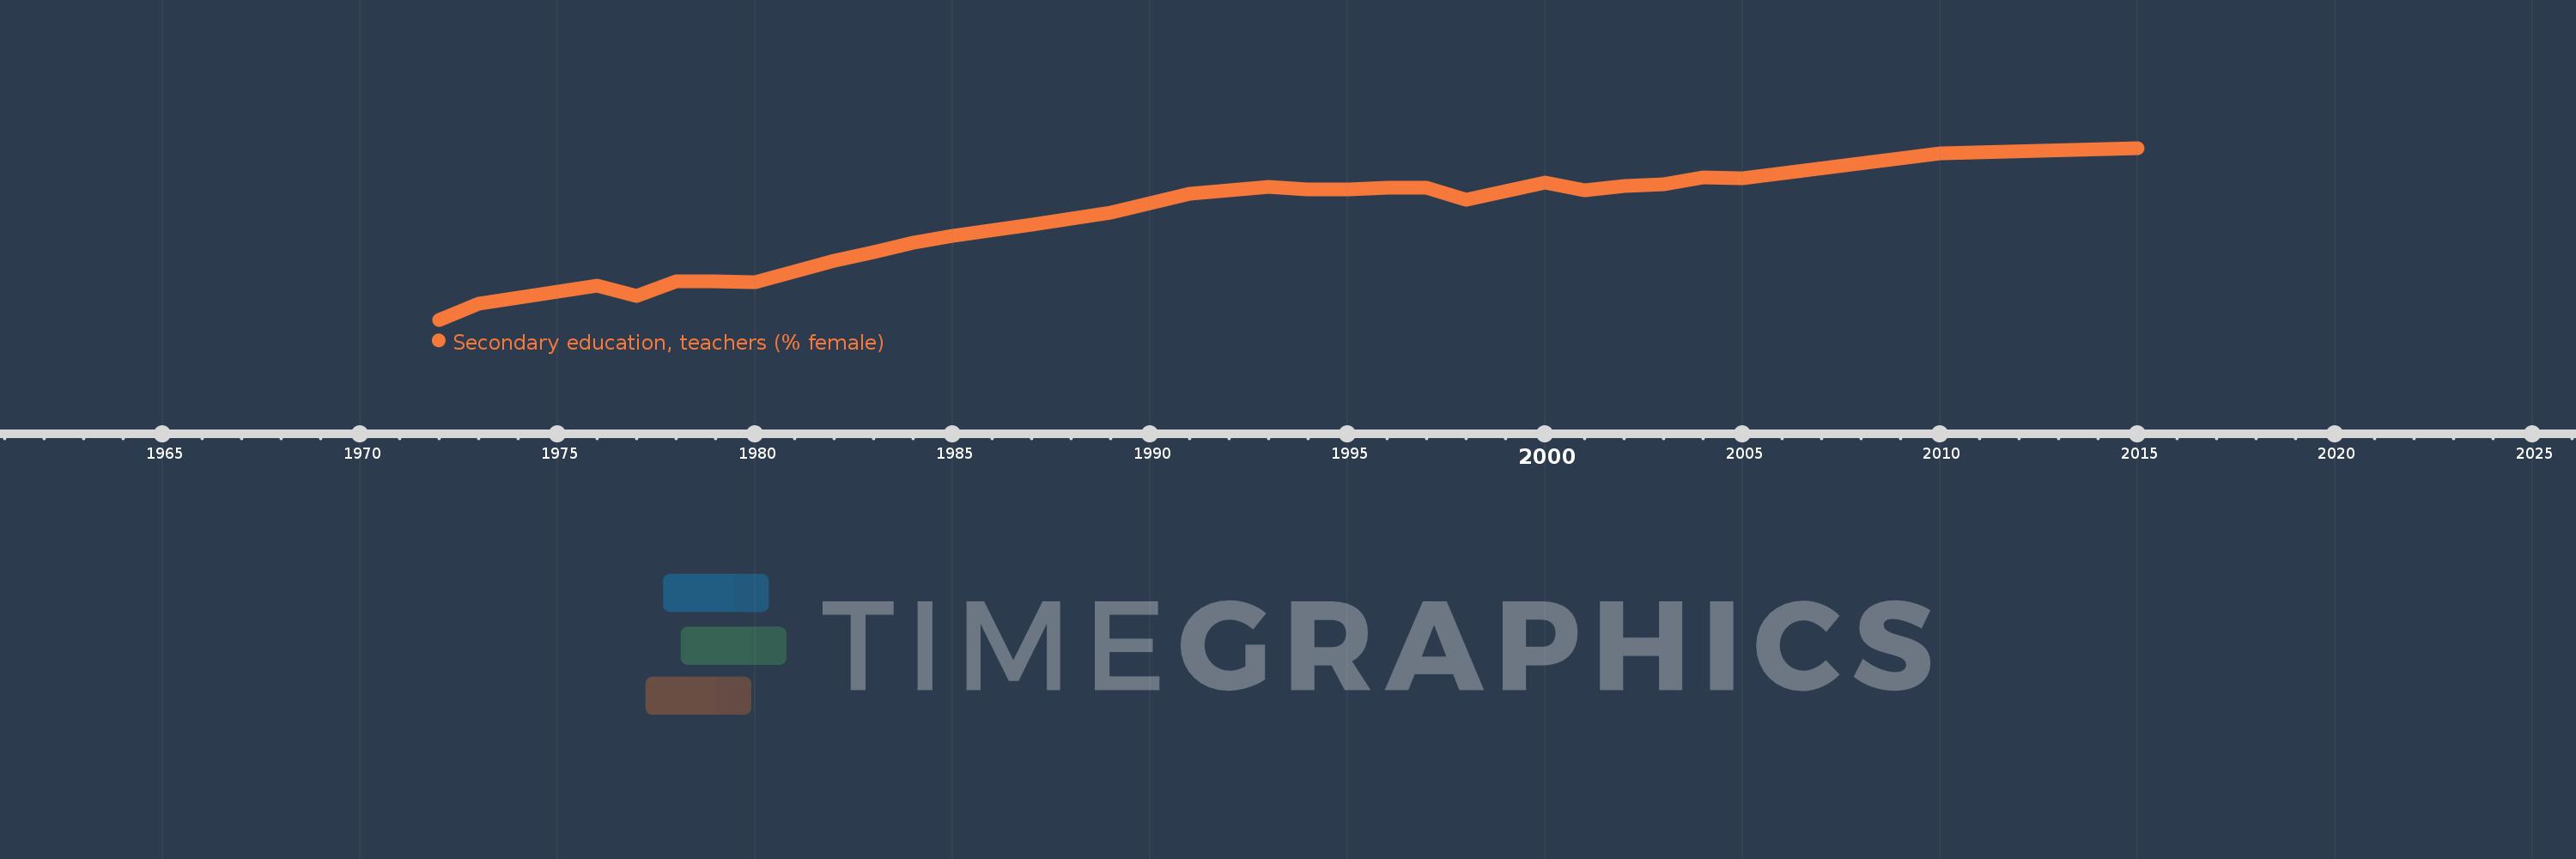
Secondary education, teachers (% female)
2015,2010,2005,2004,2003,2002,2001,2000,1998,1997,1996,1995,1994,1993,1991,1989,1988,1987,1985,1984,1983,1982,1980,1979,1978,1977,1976,1973,1972
This statistics in other country:
AfghanistanAlbaniaAlgeriaAndorraAngolaAntigua and BarbudaArab WorldArgentinaArmeniaArubaAustraliaAustriaBahamas, TheBahrainBangladeshBarbadosBelarusBelgiumBelizeBeninBermudaBhutanBoliviaBosnia and HerzegovinaBotswanaBrazilBritish Virgin IslandsBrunei DarussalamBulgariaBurkina FasoBurundiCabo VerdeCambodiaCameroonCanadaCaribbean small statesCayman IslandsCentral African RepublicCentral Europe and the BalticsChadChileChinaColombiaComorosCongo, Dem. Rep.Congo, Rep.Costa RicaCote d'IvoireCroatiaCubaCyprusCzech RepublicDenmarkDjiboutiDominicaDominican RepublicEarly-demographic dividendEast Asia & PacificEast Asia & Pacific (excluding high income)East Asia & Pacific (IDA & IBRD countries)EcuadorEgypt, Arab Rep.El SalvadorEquatorial GuineaEritreaEstoniaEthiopiaEuro areaEurope & Central AsiaEurope & Central Asia (excluding high income)Europe & Central Asia (IDA & IBRD countries)European UnionFijiFinlandFragile and conflict affected situationsFranceGabonGambia, TheGeorgiaGermanyGhanaGibraltarGreeceGrenadaGuatemalaGuineaGuinea-BissauGuyanaHeavily indebted poor countries (HIPC)High incomeHondurasHong Kong SAR, ChinaHungaryIBRD onlyIcelandIDA & IBRD totalIDA blendIDA onlyIDA totalIndiaIndonesiaIran, Islamic Rep.IraqIrelandIsraelItalyJamaicaJapanJordanKazakhstanKenyaKiribatiKorea, Dem. People’s Rep.Korea, Rep.KuwaitKyrgyz RepublicLao PDRLate-demographic dividendLatin America & Caribbean Latin America & Caribbean (excluding high income)Latin America & the Caribbean (IDA & IBRD countries)LatviaLeast developed countries: UN classificationLebanonLesothoLiberiaLibyaLiechtensteinLithuaniaLow & middle incomeLow incomeLower middle incomeLuxembourgMacao SAR, ChinaMacedonia, FYRMadagascarMalawiMalaysiaMaldivesMaliMaltaMarshall IslandsMauritaniaMauritiusMexicoMiddle East & North AfricaMiddle East & North Africa (excluding high income)Middle East & North Africa (IDA & IBRD countries)Middle incomeMoldovaMonacoMongoliaMoroccoMozambiqueMyanmarNamibiaNauruNepalNetherlandsNew ZealandNicaraguaNigerNigeriaNorth AmericaNorwayOECD membersOmanOther small statesPacific island small statesPakistanPalauPanamaPapua New GuineaParaguayPeruPhilippinesPolandPortugalPost-demographic dividendPre-demographic dividendPuerto RicoQatarRomaniaRussian FederationRwandaSamoaSan MarinoSao Tome and PrincipeSaudi ArabiaSenegalSerbiaSeychellesSierra LeoneSingaporeSint Maarten (Dutch part)Slovak RepublicSloveniaSmall statesSolomon IslandsSomaliaSouth AfricaSouth AsiaSouth Asia (IDA & IBRD)SpainSri LankaSt. Kitts and NevisSt. LuciaSt. Vincent and the GrenadinesSub-Saharan Africa Sub-Saharan Africa (excluding high income)Sub-Saharan Africa (IDA & IBRD countries)SudanSurinameSwazilandSwedenSwitzerlandSyrian Arab RepublicTajikistanTanzaniaThailandTimor-LesteTogoTongaTrinidad and TobagoTunisiaTurkeyTurks and Caicos IslandsUgandaUkraineUnited Arab EmiratesUnited KingdomUnited StatesUpper middle incomeUruguayUzbekistanVanuatuVenezuela, RBVietnamWest Bank and GazaWorldYemen, Rep.ZambiaZimbabwe Timeline:
This timeline shows a graph from 1972 to 2015 of Egypt, Arab Rep.. No data until 1971. Number of actual observations by date: 29.
Source name:
World Development Indicators
Source organization:
United Nations Educational, Scientific, and Cultural Organization (UNESCO) Institute for Statistics.
Categories, topics:
Education, Gender
Last updated:
apr 23, 2017
Indicators value changes by year
Minimum:
23.604
jan 1, 1972
Maximum:
45.128
jan 1, 2015
At the date of observation
Value
Absolute change
Change from previous value
jan 1, 1972
23.604
+23.604
0.0%
jan 1, 1973
25.642
+2.038
8.63%
jan 1, 1976
27.93
+2.288
8.92%
jan 1, 1977
26.605
-1.325
-4.74%
jan 1, 1978
28.467
+1.862
7.0%
jan 1, 1979
28.464
-0.003
-0.01%
jan 1, 1980
28.257
-0.208
-0.73%
jan 1, 1982
31.026
+2.769
9.8%
jan 1, 1983
32.04
+1.014
3.27%
jan 1, 1984
33.243
+1.203
3.76%
jan 1, 1985
34.146
+0.903
2.72%
jan 1, 1987
35.493
+1.346
3.94%
jan 1, 1988
36.238
+0.745
2.1%
jan 1, 1989
37.06
+0.822
2.27%
jan 1, 1991
39.357
+2.297
6.2%
jan 1, 1993
40.221
+0.865
2.2%
jan 1, 1994
39.91
-0.311
-0.77%
jan 1, 1995
39.909
-0.001
0.0%
jan 1, 1996
40.129
+0.22
0.55%
jan 1, 1997
40.106
-0.023
-0.06%
jan 1, 1998
38.624
-1.482
-3.69%
jan 1, 2000
40.793
+2.169
5.61%
jan 1, 2001
39.829
-0.964
-2.36%
jan 1, 2002
40.383
+0.554
1.39%
jan 1, 2003
40.583
+0.2
0.5%
jan 1, 2004
41.402
+0.818
2.02%
jan 1, 2005
41.293
-0.108
-0.26%
jan 1, 2010
44.497
+3.204
7.76%
jan 1, 2015
45.128
+0.631
1.42%
Ranking of countries by current statistics by years


Comments: