29
/
en
AIzaSyAYiBZKx7MnpbEhh9jyipgxe19OcubqV5w
April 1, 2024
116235
Cuba
CUB
true
2
1
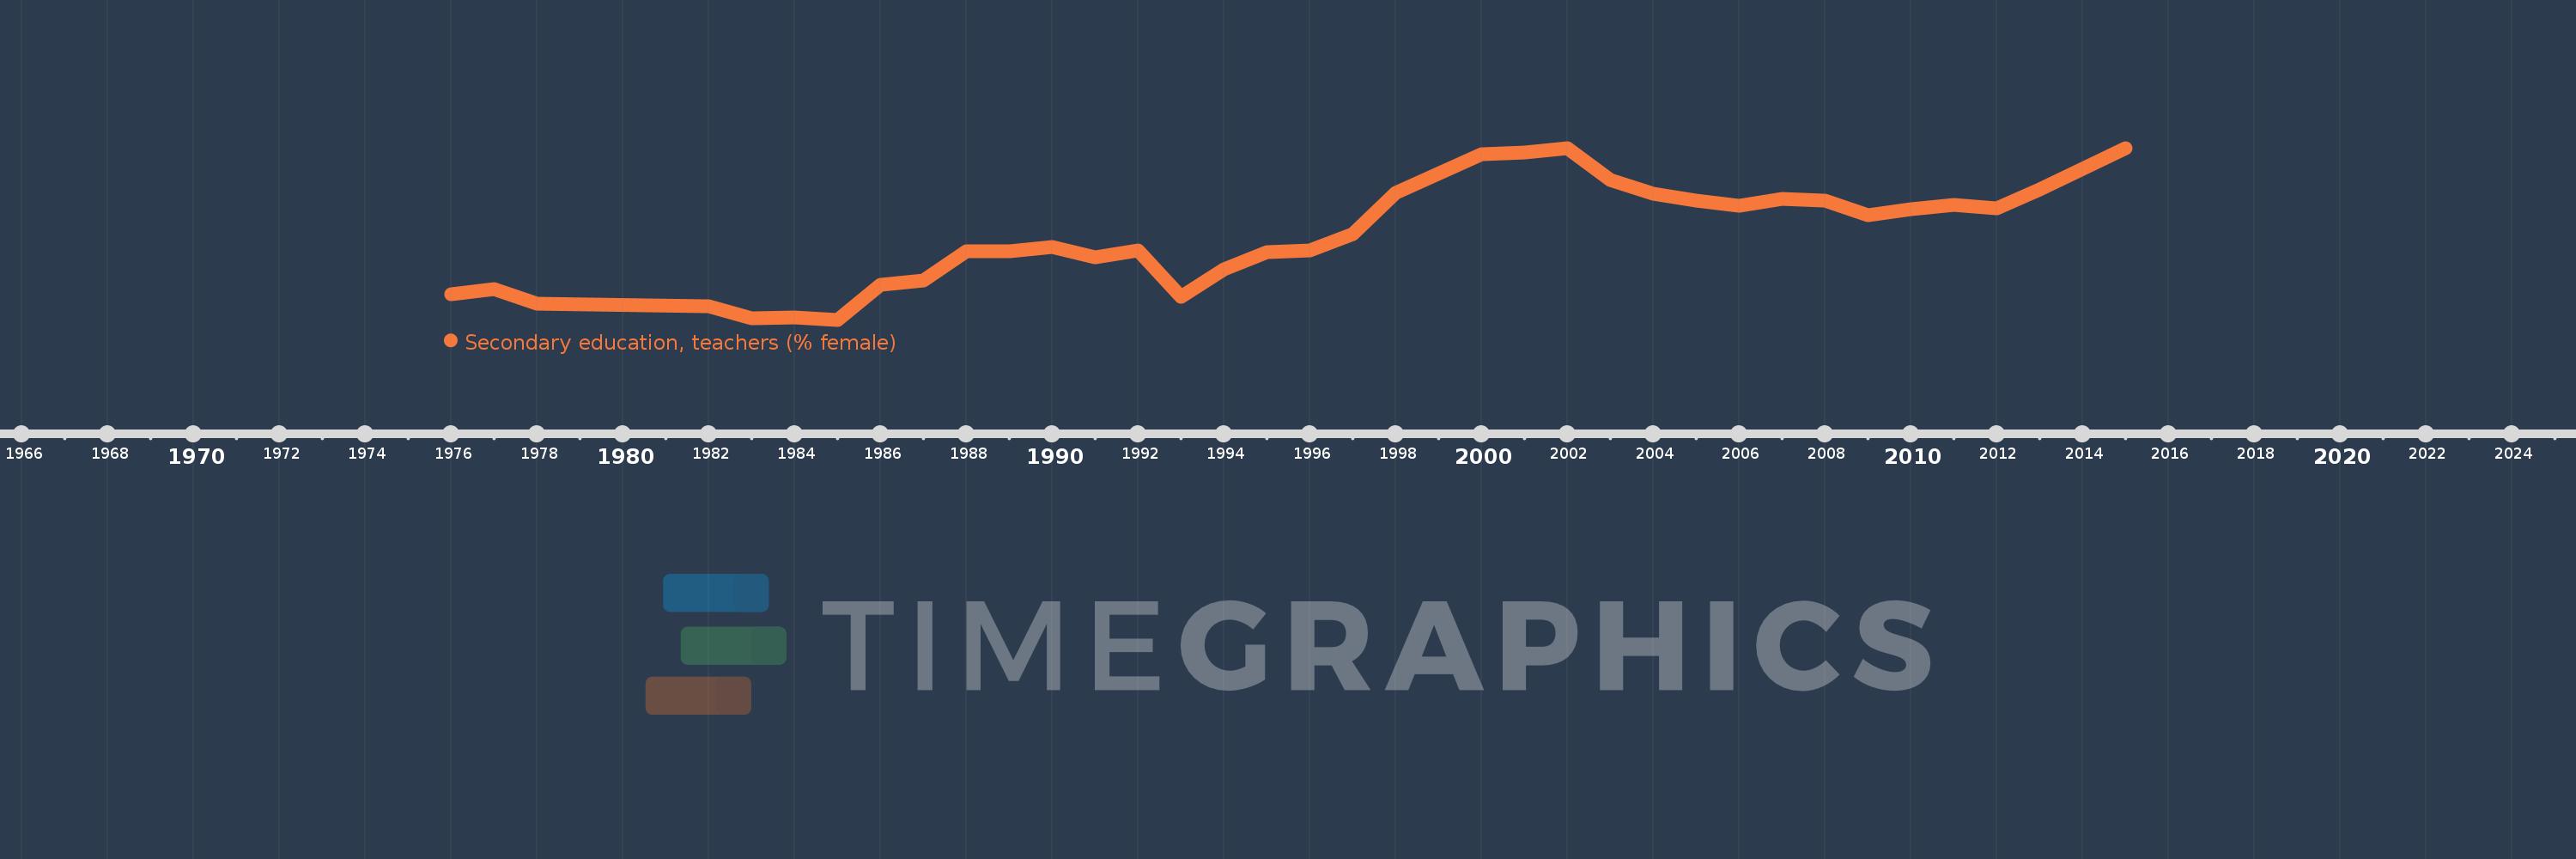
Secondary education, teachers (% female)
2015,2013,2012,2011,2010,2009,2008,2007,2006,2005,2004,2003,2002,2001,2000,1998,1997,1996,1995,1994,1993,1992,1991,1990,1989,1988,1987,1986,1985,1984,1983,1982,1978,1977,1976
This statistics in other country:
AfghanistanAlbaniaAlgeriaAndorraAngolaAntigua and BarbudaArab WorldArgentinaArmeniaArubaAustraliaAustriaBahamas, TheBahrainBangladeshBarbadosBelarusBelgiumBelizeBeninBermudaBhutanBoliviaBosnia and HerzegovinaBotswanaBrazilBritish Virgin IslandsBrunei DarussalamBulgariaBurkina FasoBurundiCabo VerdeCambodiaCameroonCanadaCaribbean small statesCayman IslandsCentral African RepublicCentral Europe and the BalticsChadChileChinaColombiaComorosCongo, Dem. Rep.Congo, Rep.Costa RicaCote d'IvoireCroatiaCubaCyprusCzech RepublicDenmarkDjiboutiDominicaDominican RepublicEarly-demographic dividendEast Asia & PacificEast Asia & Pacific (excluding high income)East Asia & Pacific (IDA & IBRD countries)EcuadorEgypt, Arab Rep.El SalvadorEquatorial GuineaEritreaEstoniaEthiopiaEuro areaEurope & Central AsiaEurope & Central Asia (excluding high income)Europe & Central Asia (IDA & IBRD countries)European UnionFijiFinlandFragile and conflict affected situationsFranceGabonGambia, TheGeorgiaGermanyGhanaGibraltarGreeceGrenadaGuatemalaGuineaGuinea-BissauGuyanaHeavily indebted poor countries (HIPC)High incomeHondurasHong Kong SAR, ChinaHungaryIBRD onlyIcelandIDA & IBRD totalIDA blendIDA onlyIDA totalIndiaIndonesiaIran, Islamic Rep.IraqIrelandIsraelItalyJamaicaJapanJordanKazakhstanKenyaKiribatiKorea, Dem. People’s Rep.Korea, Rep.KuwaitKyrgyz RepublicLao PDRLate-demographic dividendLatin America & Caribbean Latin America & Caribbean (excluding high income)Latin America & the Caribbean (IDA & IBRD countries)LatviaLeast developed countries: UN classificationLebanonLesothoLiberiaLibyaLiechtensteinLithuaniaLow & middle incomeLow incomeLower middle incomeLuxembourgMacao SAR, ChinaMacedonia, FYRMadagascarMalawiMalaysiaMaldivesMaliMaltaMarshall IslandsMauritaniaMauritiusMexicoMiddle East & North AfricaMiddle East & North Africa (excluding high income)Middle East & North Africa (IDA & IBRD countries)Middle incomeMoldovaMonacoMongoliaMoroccoMozambiqueMyanmarNamibiaNauruNepalNetherlandsNew ZealandNicaraguaNigerNigeriaNorth AmericaNorwayOECD membersOmanOther small statesPacific island small statesPakistanPalauPanamaPapua New GuineaParaguayPeruPhilippinesPolandPortugalPost-demographic dividendPre-demographic dividendPuerto RicoQatarRomaniaRussian FederationRwandaSamoaSan MarinoSao Tome and PrincipeSaudi ArabiaSenegalSerbiaSeychellesSierra LeoneSingaporeSint Maarten (Dutch part)Slovak RepublicSloveniaSmall statesSolomon IslandsSomaliaSouth AfricaSouth AsiaSouth Asia (IDA & IBRD)SpainSri LankaSt. Kitts and NevisSt. LuciaSt. Vincent and the GrenadinesSub-Saharan Africa Sub-Saharan Africa (excluding high income)Sub-Saharan Africa (IDA & IBRD countries)SudanSurinameSwazilandSwedenSwitzerlandSyrian Arab RepublicTajikistanTanzaniaThailandTimor-LesteTogoTongaTrinidad and TobagoTunisiaTurkeyTurks and Caicos IslandsUgandaUkraineUnited Arab EmiratesUnited KingdomUnited StatesUpper middle incomeUruguayUzbekistanVanuatuVenezuela, RBVietnamWest Bank and GazaWorldYemen, Rep.ZambiaZimbabwe Timeline:
This timeline shows a graph from 1976 to 2015 of Cuba. No data until 1975. Number of actual observations by date: 35.
Source name:
World Development Indicators
Source organization:
United Nations Educational, Scientific, and Cultural Organization (UNESCO) Institute for Statistics.
Categories, topics:
Education, Gender
Last updated:
apr 23, 2017
Indicators value changes by year
Minimum:
44.327
jan 1, 1985
Maximum:
61.065
jan 1, 2002
At the date of observation
Value
Absolute change
Change from previous value
jan 1, 1976
46.845
+46.845
0.0%
jan 1, 1977
47.35
+0.506
1.08%
jan 1, 1978
45.893
-1.457
-3.08%
jan 1, 1982
45.611
-0.283
-0.62%
jan 1, 1983
44.474
-1.137
-2.49%
jan 1, 1984
44.531
+0.057
0.13%
jan 1, 1985
44.327
-0.204
-0.46%
jan 1, 1986
47.741
+3.414
7.7%
jan 1, 1987
48.12
+0.379
0.79%
jan 1, 1988
51.016
+2.895
6.02%
jan 1, 1989
50.999
-0.016
-0.03%
jan 1, 1990
51.433
+0.434
0.85%
jan 1, 1991
50.429
-1.004
-1.95%
jan 1, 1992
51.052
+0.623
1.23%
jan 1, 1993
46.587
-4.465
-8.75%
jan 1, 1994
49.216
+2.629
5.64%
jan 1, 1995
50.887
+1.671
3.4%
jan 1, 1996
51.108
+0.221
0.43%
jan 1, 1997
52.638
+1.53
2.99%
jan 1, 1998
56.657
+4.02
7.64%
jan 1, 2000
60.458
+3.8
6.71%
jan 1, 2001
60.627
+0.17
0.28%
jan 1, 2002
61.065
+0.437
0.72%
jan 1, 2003
57.917
-3.147
-5.15%
jan 1, 2004
56.618
-1.299
-2.24%
jan 1, 2005
55.965
-0.653
-1.15%
jan 1, 2006
55.451
-0.515
-0.92%
jan 1, 2007
56.095
+0.644
1.16%
jan 1, 2008
55.964
-0.13
-0.23%
jan 1, 2009
54.542
-1.423
-2.54%
jan 1, 2010
55.08
+0.538
0.99%
jan 1, 2011
55.492
+0.412
0.75%
jan 1, 2012
55.179
-0.312
-0.56%
jan 1, 2013
56.982
+1.802
3.27%
jan 1, 2015
61.063
+4.082
7.16%
Ranking of countries by current statistics by years


Comments: