29
/
en
AIzaSyAYiBZKx7MnpbEhh9jyipgxe19OcubqV5w
April 1, 2024
46178
Low income
LIC
false
2
1
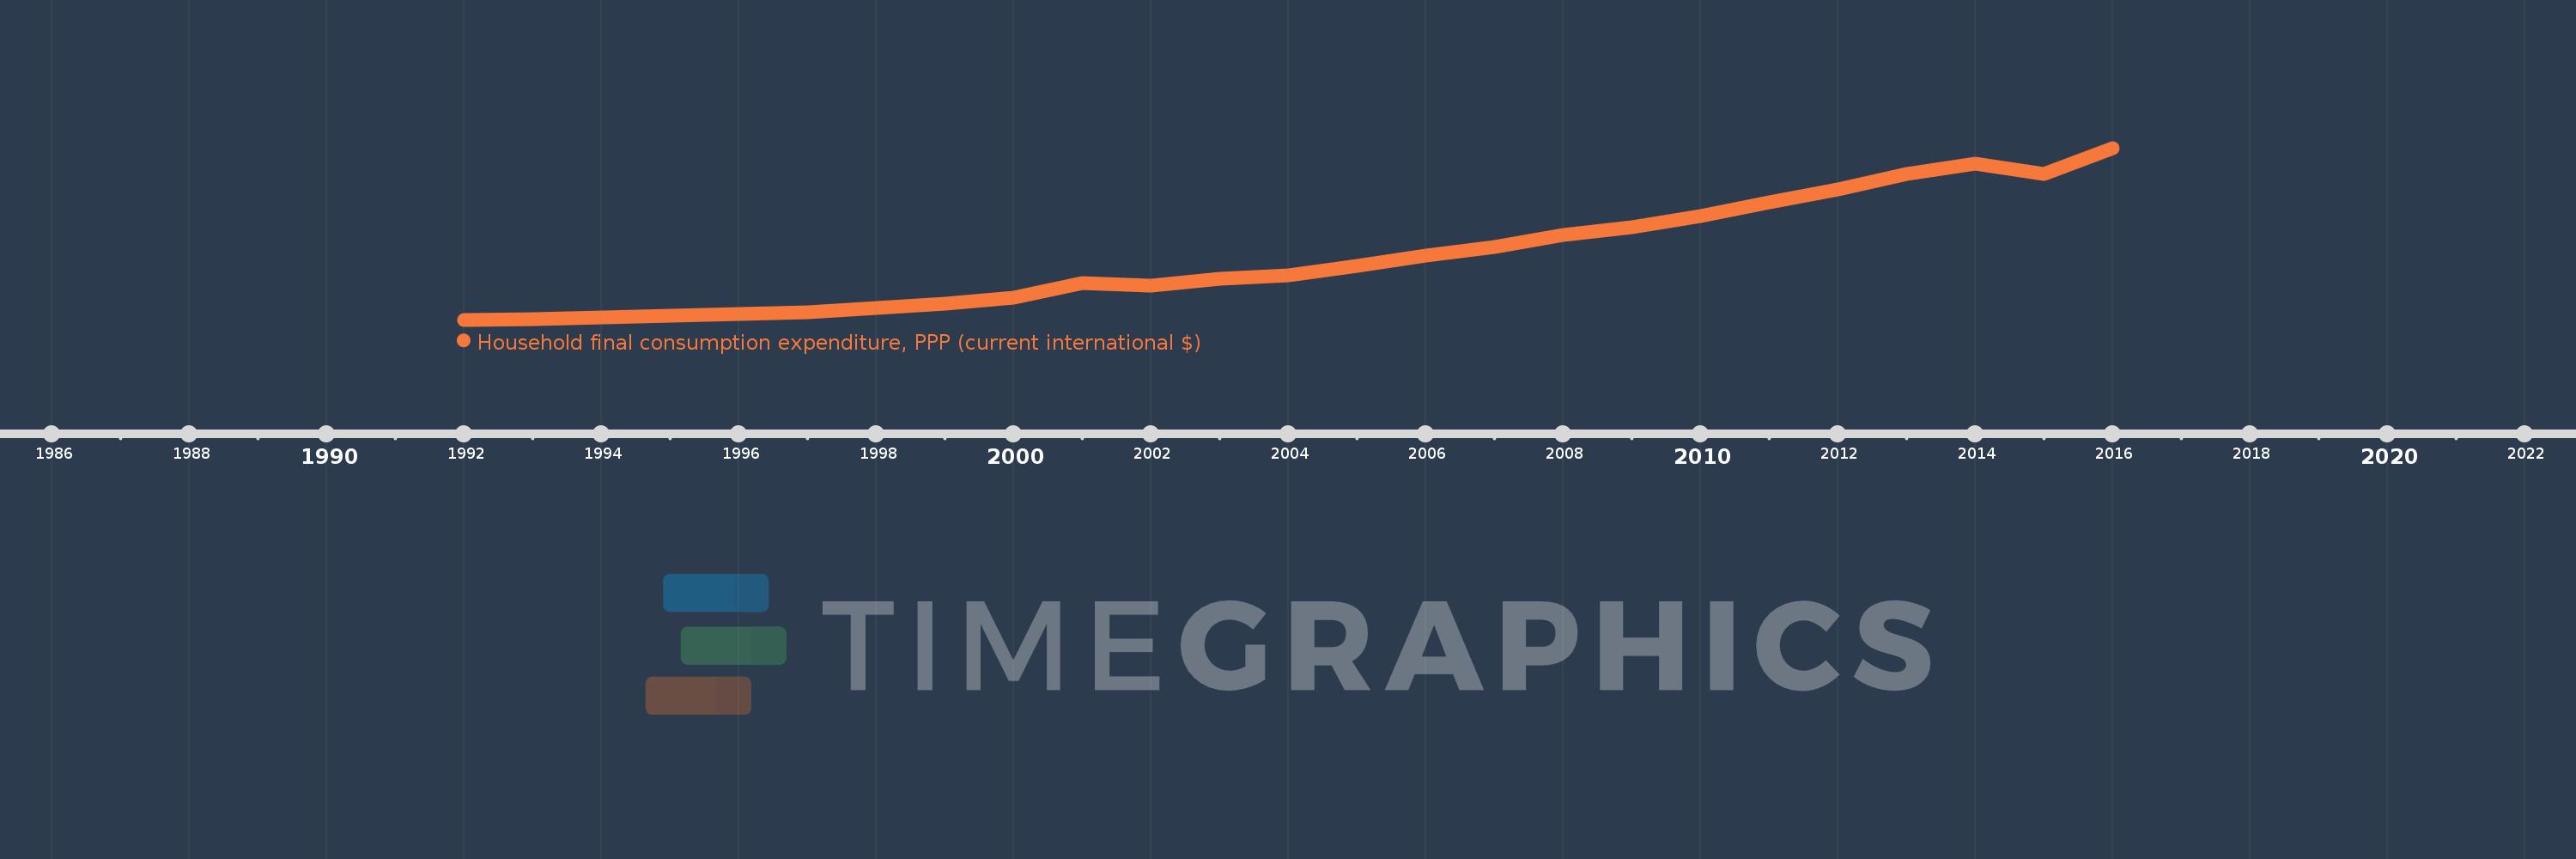
Household final consumption expenditure, PPP (current international $)
2016,2015,2014,2013,2012,2011,2010,2009,2008,2007,2006,2005,2004,2003,2002,2001,2000,1999,1998,1997,1996,1995,1994,1993,1992
This statistics in other country:
AfghanistanAlbaniaAlgeriaAngolaAntigua and BarbudaArab WorldArgentinaArmeniaArubaAustraliaAustriaAzerbaijanBahamas, TheBahrainBangladeshBarbadosBelarusBelgiumBelizeBeninBermudaBhutanBoliviaBosnia and HerzegovinaBotswanaBrazilBrunei DarussalamBulgariaBurkina FasoBurundiCabo VerdeCambodiaCameroonCanadaCaribbean small statesCentral African RepublicCentral Europe and the BalticsChadChileChinaColombiaComorosCongo, Dem. Rep.Congo, Rep.Costa RicaCote d'IvoireCroatiaCubaCyprusCzech RepublicDenmarkDjiboutiDominicaDominican RepublicEarly-demographic dividendEast Asia & PacificEast Asia & Pacific (excluding high income)East Asia & Pacific (IDA & IBRD countries)EcuadorEgypt, Arab Rep.El SalvadorEquatorial GuineaEritreaEstoniaEthiopiaEuro areaEurope & Central AsiaEurope & Central Asia (excluding high income)Europe & Central Asia (IDA & IBRD countries)European UnionFijiFinlandFranceGabonGambia, TheGeorgiaGermanyGhanaGreeceGrenadaGuatemalaGuineaGuinea-BissauGuyanaHaitiHeavily indebted poor countries (HIPC)High incomeHondurasHong Kong SAR, ChinaHungaryIBRD onlyIcelandIDA & IBRD totalIDA blendIDA onlyIDA totalIndiaIndonesiaIran, Islamic Rep.IrelandIsraelItalyJamaicaJapanJordanKazakhstanKenyaKorea, Rep.KosovoKuwaitKyrgyz RepublicLao PDRLate-demographic dividendLatin America & Caribbean Latin America & Caribbean (excluding high income)Latin America & the Caribbean (IDA & IBRD countries)LatviaLeast developed countries: UN classificationLebanonLiberiaLibyaLithuaniaLow & middle incomeLow incomeLower middle incomeLuxembourgMacao SAR, ChinaMacedonia, FYRMadagascarMalawiMalaysiaMaliMaltaMauritaniaMauritiusMexicoMiddle East & North AfricaMiddle East & North Africa (excluding high income)Middle East & North Africa (IDA & IBRD countries)Middle incomeMoldovaMongoliaMontenegroMoroccoMozambiqueNamibiaNepalNetherlandsNew ZealandNicaraguaNigerNigeriaNorth AmericaNorwayOECD membersOmanOther small statesPakistanPanamaPapua New GuineaParaguayPeruPhilippinesPolandPortugalPost-demographic dividendPre-demographic dividendPuerto RicoQatarRomaniaRussian FederationRwandaSaudi ArabiaSenegalSerbiaSeychellesSierra LeoneSingaporeSlovak RepublicSloveniaSmall statesSolomon IslandsSouth AfricaSouth AsiaSouth Asia (IDA & IBRD)South SudanSpainSri LankaSt. Kitts and NevisSt. LuciaSt. Vincent and the GrenadinesSub-Saharan Africa Sub-Saharan Africa (excluding high income)Sub-Saharan Africa (IDA & IBRD countries)SudanSurinameSwazilandSwedenSwitzerlandSyrian Arab RepublicTajikistanTanzaniaThailandTimor-LesteTogoTongaTrinidad and TobagoTunisiaTurkeyTurkmenistanUgandaUkraineUnited Arab EmiratesUnited KingdomUnited StatesUpper middle incomeUruguayUzbekistanVanuatuVenezuela, RBVietnamWest Bank and GazaWorldYemen, Rep.ZambiaZimbabwe Timeline:
This timeline shows a graph from 1992 to 2016 of Low income. No data until 1991. Number of actual observations by date: 25.
Source name:
World Development Indicators
Source organization:
World Bank, International Comparison Program database.
Categories, topics:
Economy & Growth
Last updated:
apr 23, 2017
Indicators value changes by year
Minimum:
139.288 bln
jan 1, 1992
Maximum:
702.135 bln
jan 1, 2016
At the date of observation
Value
Absolute change
Change from previous value
jan 1, 1992
139.288 bln
+139.288 bln
0.0%
jan 1, 1993
140.141 bln
+852.432 mln
0.61%
jan 1, 1994
147.253 bln
+7.112 bln
5.08%
jan 1, 1995
153.088 bln
+5.835 bln
3.96%
jan 1, 1996
158.816 bln
+5.728 bln
3.74%
jan 1, 1997
164.858 bln
+6.042 bln
3.8%
jan 1, 1998
178.092 bln
+13.234 bln
8.03%
jan 1, 1999
192.88 bln
+14.788 bln
8.3%
jan 1, 2000
211.583 bln
+18.703 bln
9.7%
jan 1, 2001
259.422 bln
+47.838 bln
22.61%
jan 1, 2002
250.831 bln
-8.59 bln
-3.31%
jan 1, 2003
272.297 bln
+21.466 bln
8.56%
jan 1, 2004
285.719 bln
+13.422 bln
4.93%
jan 1, 2005
315.695 bln
+29.975 bln
10.49%
jan 1, 2006
349.01 bln
+33.315 bln
10.55%
jan 1, 2007
378.563 bln
+29.553 bln
8.47%
jan 1, 2008
415.771 bln
+37.208 bln
9.83%
jan 1, 2009
442.488 bln
+26.717 bln
6.43%
jan 1, 2010
478.348 bln
+35.86 bln
8.1%
jan 1, 2011
524.808 bln
+46.46 bln
9.71%
jan 1, 2012
565.16 bln
+40.352 bln
7.69%
jan 1, 2013
616.041 bln
+50.881 bln
9.0%
jan 1, 2014
649.733 bln
+33.692 bln
5.47%
jan 1, 2015
617.836 bln
-31.898 bln
-4.91%
jan 1, 2016
702.135 bln
+84.299 bln
13.64%
Ranking of countries by current statistics by years


Comments: