29
/
en
AIzaSyAYiBZKx7MnpbEhh9jyipgxe19OcubqV5w
April 1, 2024
216534
Pakistan
PAK
true
2
1
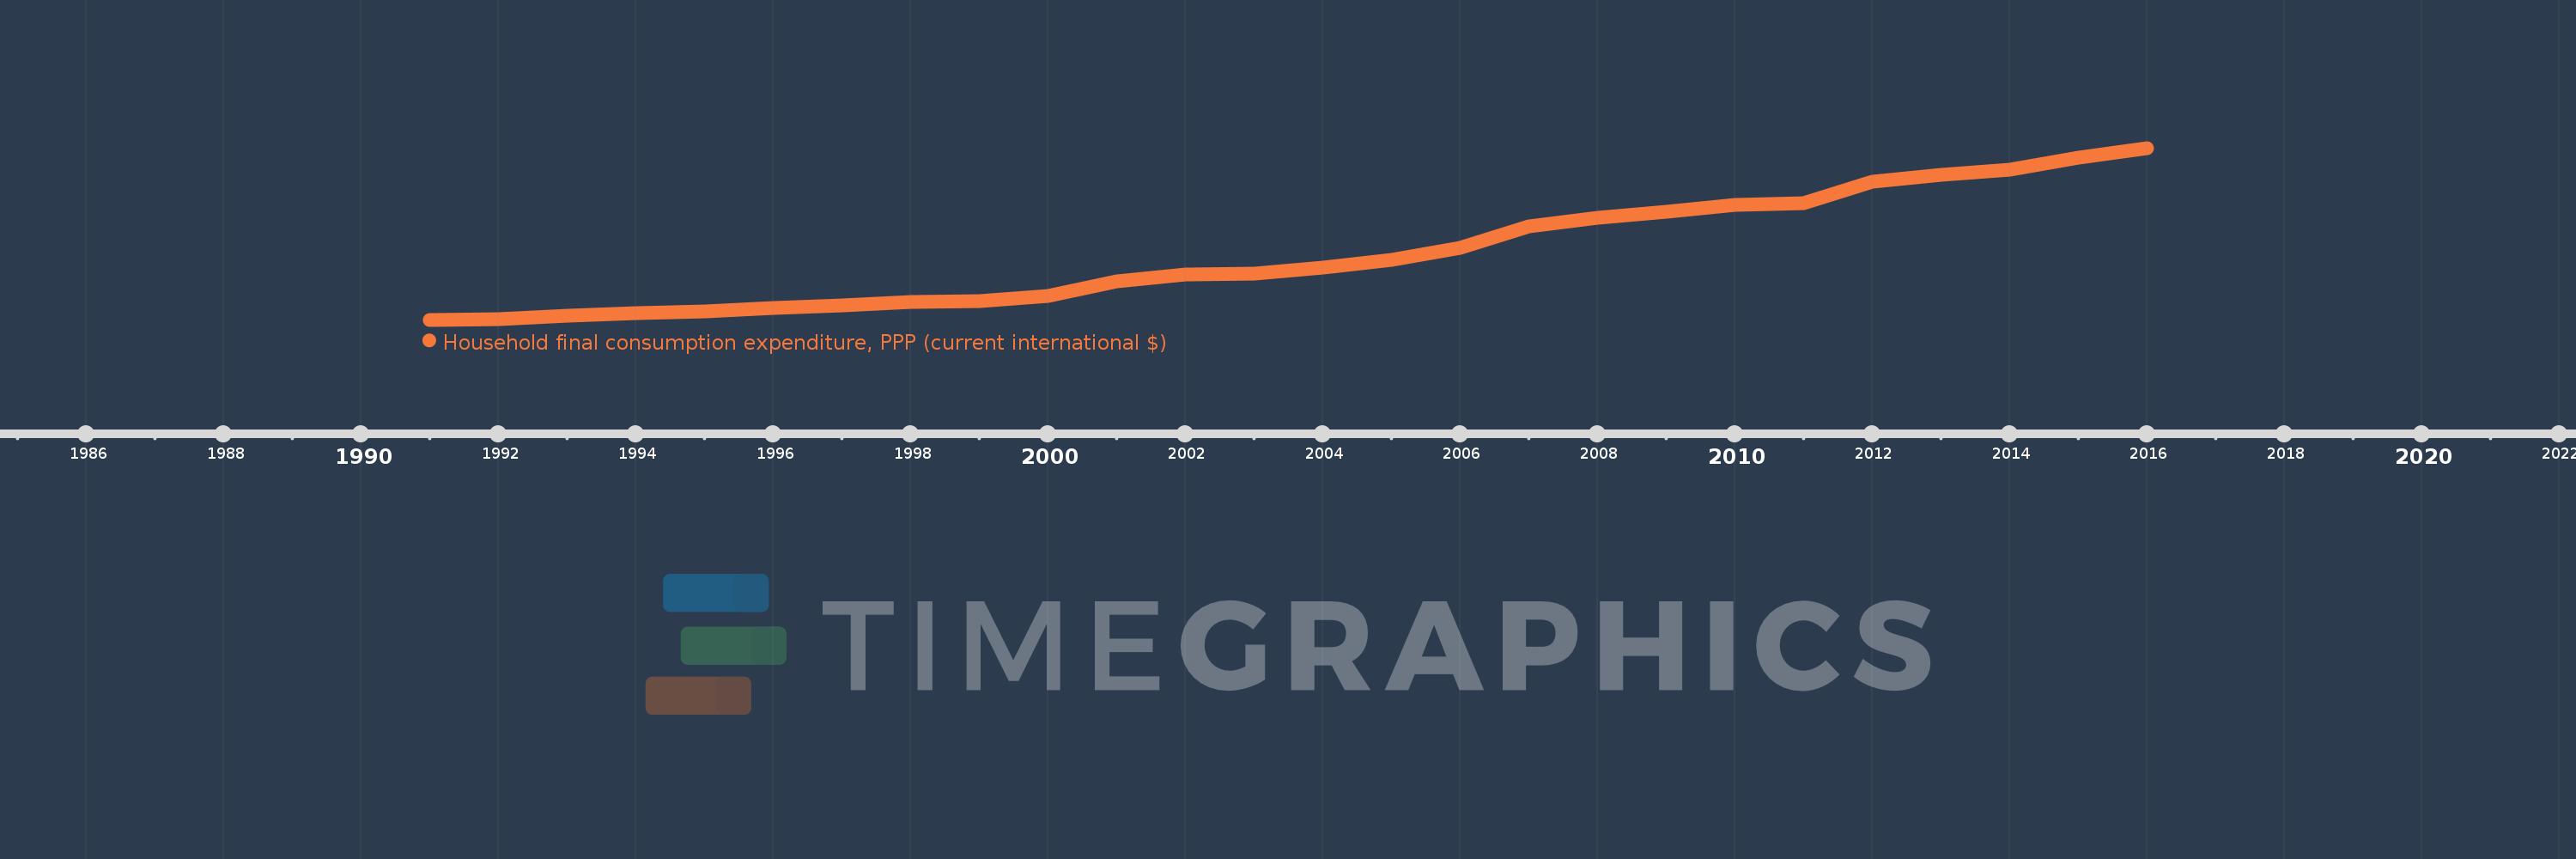
Household final consumption expenditure, PPP (current international $)
2016,2015,2014,2013,2012,2011,2010,2009,2008,2007,2006,2005,2004,2003,2002,2001,2000,1999,1998,1997,1996,1995,1994,1993,1992,1991
This statistics in other country:
AfghanistanAlbaniaAlgeriaAngolaAntigua and BarbudaArab WorldArgentinaArmeniaArubaAustraliaAustriaAzerbaijanBahamas, TheBahrainBangladeshBarbadosBelarusBelgiumBelizeBeninBermudaBhutanBoliviaBosnia and HerzegovinaBotswanaBrazilBrunei DarussalamBulgariaBurkina FasoBurundiCabo VerdeCambodiaCameroonCanadaCaribbean small statesCentral African RepublicCentral Europe and the BalticsChadChileChinaColombiaComorosCongo, Dem. Rep.Congo, Rep.Costa RicaCote d'IvoireCroatiaCubaCyprusCzech RepublicDenmarkDjiboutiDominicaDominican RepublicEarly-demographic dividendEast Asia & PacificEast Asia & Pacific (excluding high income)East Asia & Pacific (IDA & IBRD countries)EcuadorEgypt, Arab Rep.El SalvadorEquatorial GuineaEritreaEstoniaEthiopiaEuro areaEurope & Central AsiaEurope & Central Asia (excluding high income)Europe & Central Asia (IDA & IBRD countries)European UnionFijiFinlandFranceGabonGambia, TheGeorgiaGermanyGhanaGreeceGrenadaGuatemalaGuineaGuinea-BissauGuyanaHaitiHeavily indebted poor countries (HIPC)High incomeHondurasHong Kong SAR, ChinaHungaryIBRD onlyIcelandIDA & IBRD totalIDA blendIDA onlyIDA totalIndiaIndonesiaIran, Islamic Rep.IrelandIsraelItalyJamaicaJapanJordanKazakhstanKenyaKorea, Rep.KosovoKuwaitKyrgyz RepublicLao PDRLate-demographic dividendLatin America & Caribbean Latin America & Caribbean (excluding high income)Latin America & the Caribbean (IDA & IBRD countries)LatviaLeast developed countries: UN classificationLebanonLiberiaLibyaLithuaniaLow & middle incomeLow incomeLower middle incomeLuxembourgMacao SAR, ChinaMacedonia, FYRMadagascarMalawiMalaysiaMaliMaltaMauritaniaMauritiusMexicoMiddle East & North AfricaMiddle East & North Africa (excluding high income)Middle East & North Africa (IDA & IBRD countries)Middle incomeMoldovaMongoliaMontenegroMoroccoMozambiqueNamibiaNepalNetherlandsNew ZealandNicaraguaNigerNigeriaNorth AmericaNorwayOECD membersOmanOther small statesPakistanPanamaPapua New GuineaParaguayPeruPhilippinesPolandPortugalPost-demographic dividendPre-demographic dividendPuerto RicoQatarRomaniaRussian FederationRwandaSaudi ArabiaSenegalSerbiaSeychellesSierra LeoneSingaporeSlovak RepublicSloveniaSmall statesSolomon IslandsSouth AfricaSouth AsiaSouth Asia (IDA & IBRD)South SudanSpainSri LankaSt. Kitts and NevisSt. LuciaSt. Vincent and the GrenadinesSub-Saharan Africa Sub-Saharan Africa (excluding high income)Sub-Saharan Africa (IDA & IBRD countries)SudanSurinameSwazilandSwedenSwitzerlandSyrian Arab RepublicTajikistanTanzaniaThailandTimor-LesteTogoTongaTrinidad and TobagoTunisiaTurkeyTurkmenistanUgandaUkraineUnited Arab EmiratesUnited KingdomUnited StatesUpper middle incomeUruguayUzbekistanVanuatuVenezuela, RBVietnamWest Bank and GazaWorldYemen, Rep.ZambiaZimbabwe Timeline:
This timeline shows a graph from 1991 to 2016 of Pakistan. No data until 1990. Number of actual observations by date: 26.
Source name:
World Development Indicators
Source organization:
World Bank, International Comparison Program database.
Categories, topics:
Economy & Growth
Last updated:
apr 23, 2017
Indicators value changes by year
Minimum:
90.487 bln
jan 1, 1991
Maximum:
702.41 bln
jan 1, 2016
At the date of observation
Value
Absolute change
Change from previous value
jan 1, 1991
90.487 bln
+90.487 bln
0.0%
jan 1, 1992
92.686 bln
+2.199 bln
2.43%
jan 1, 1993
106.106 bln
+13.421 bln
14.48%
jan 1, 1994
113.3 bln
+7.193 bln
6.78%
jan 1, 1995
119.296 bln
+5.996 bln
5.29%
jan 1, 1996
132.908 bln
+13.613 bln
11.41%
jan 1, 1997
141.726 bln
+8.818 bln
6.63%
jan 1, 1998
153.232 bln
+11.505 bln
8.12%
jan 1, 1999
155.469 bln
+2.238 bln
1.46%
jan 1, 2000
175.817 bln
+20.347 bln
13.09%
jan 1, 2001
225.832 bln
+50.015 bln
28.45%
jan 1, 2002
250.658 bln
+24.826 bln
10.99%
jan 1, 2003
255.64 bln
+4.982 bln
1.99%
jan 1, 2004
274.723 bln
+19.083 bln
7.46%
jan 1, 2005
305.093 bln
+30.37 bln
11.05%
jan 1, 2006
345.683 bln
+40.59 bln
13.3%
jan 1, 2007
421.741 bln
+76.058 bln
22.0%
jan 1, 2008
454.851 bln
+33.11 bln
7.85%
jan 1, 2009
475.129 bln
+20.278 bln
4.46%
jan 1, 2010
500.106 bln
+24.977 bln
5.26%
jan 1, 2011
505.925 bln
+5.819 bln
1.16%
jan 1, 2012
583.582 bln
+77.656 bln
15.35%
jan 1, 2013
605.183 bln
+21.601 bln
3.7%
jan 1, 2014
624.159 bln
+18.976 bln
3.14%
jan 1, 2015
666.935 bln
+42.776 bln
6.85%
jan 1, 2016
702.41 bln
+35.475 bln
5.32%
Ranking of countries by current statistics by years


Comments: