29
/
en
AIzaSyAYiBZKx7MnpbEhh9jyipgxe19OcubqV5w
April 1, 2024
220943
Paraguay
PRY
true
2
1
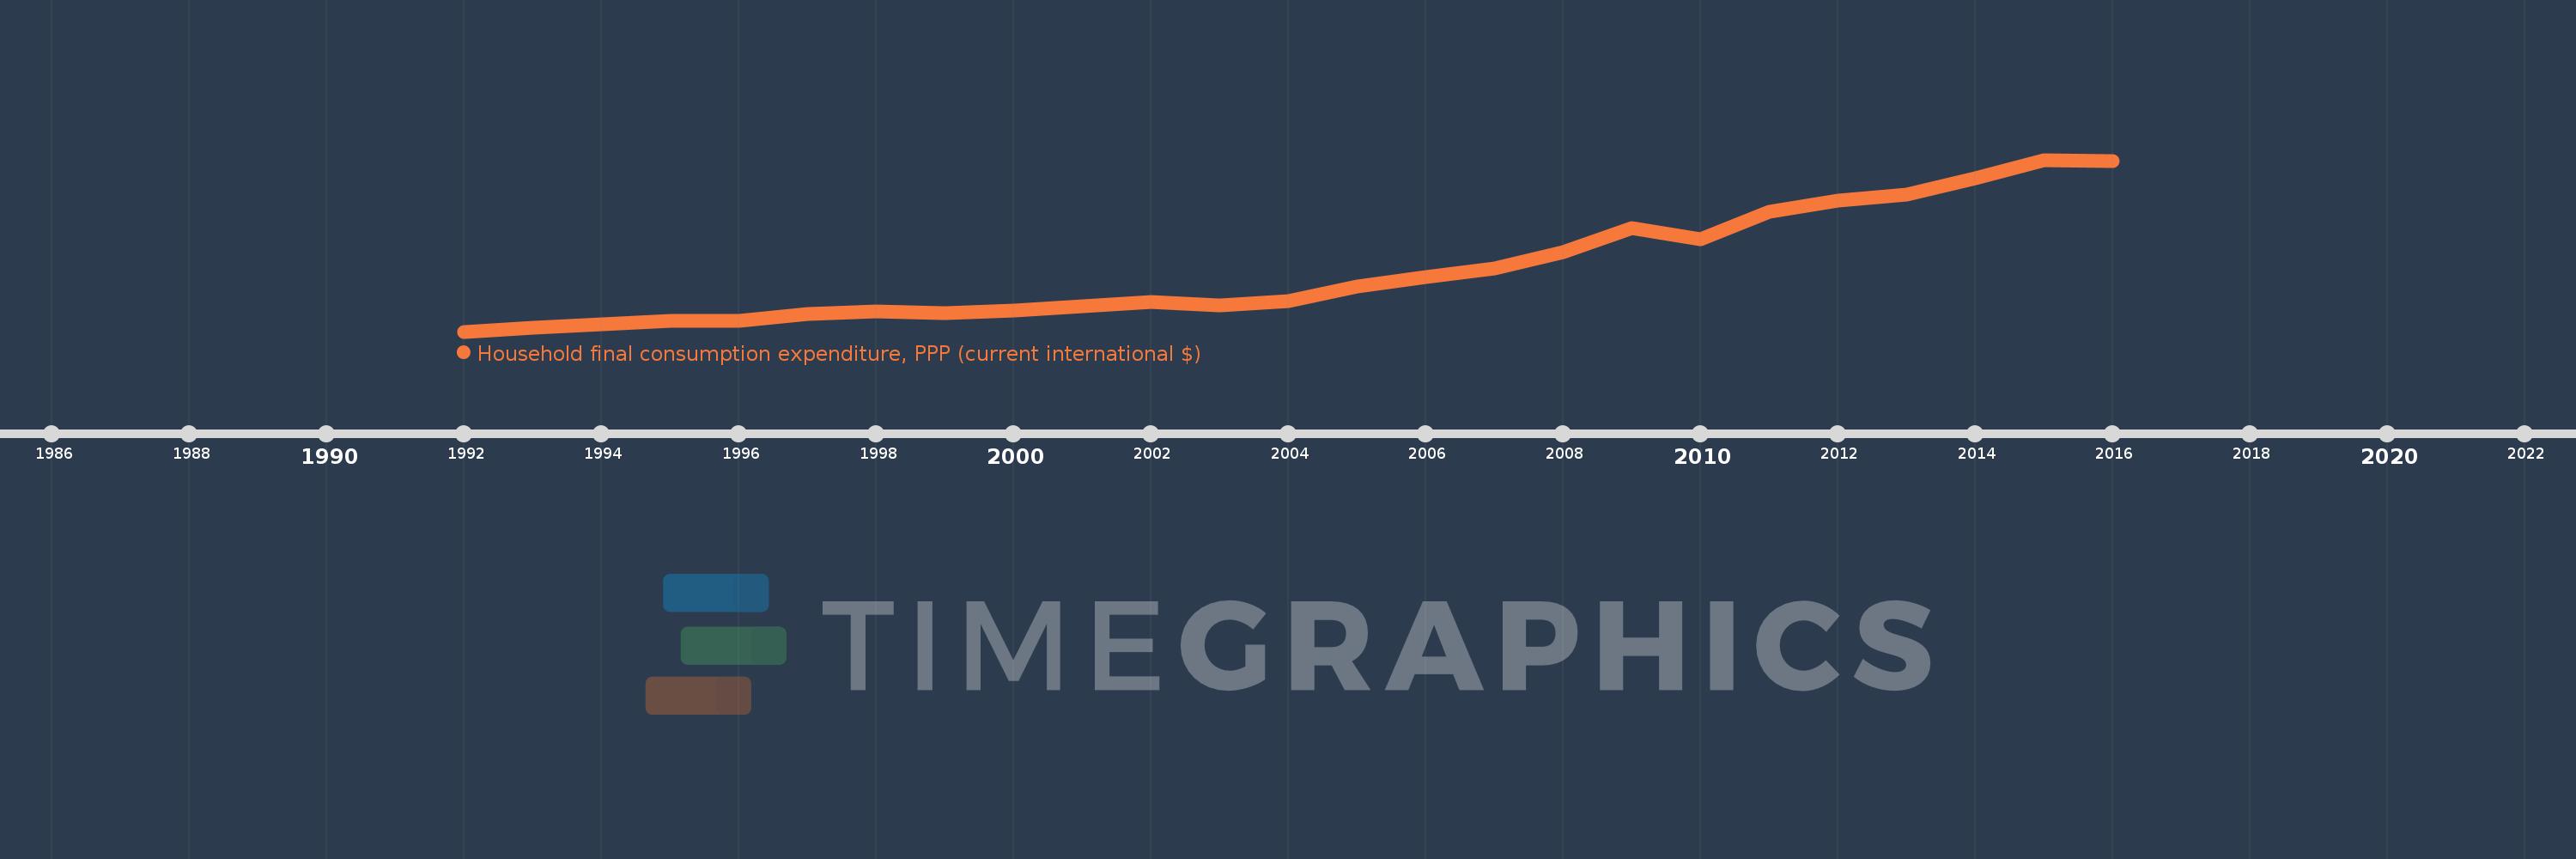
Household final consumption expenditure, PPP (current international $)
2016,2015,2014,2013,2012,2011,2010,2009,2008,2007,2006,2005,2004,2003,2002,2001,2000,1999,1998,1997,1996,1995,1994,1993,1992
This statistics in other country:
AfghanistanAlbaniaAlgeriaAngolaAntigua and BarbudaArab WorldArgentinaArmeniaArubaAustraliaAustriaAzerbaijanBahamas, TheBahrainBangladeshBarbadosBelarusBelgiumBelizeBeninBermudaBhutanBoliviaBosnia and HerzegovinaBotswanaBrazilBrunei DarussalamBulgariaBurkina FasoBurundiCabo VerdeCambodiaCameroonCanadaCaribbean small statesCentral African RepublicCentral Europe and the BalticsChadChileChinaColombiaComorosCongo, Dem. Rep.Congo, Rep.Costa RicaCote d'IvoireCroatiaCubaCyprusCzech RepublicDenmarkDjiboutiDominicaDominican RepublicEarly-demographic dividendEast Asia & PacificEast Asia & Pacific (excluding high income)East Asia & Pacific (IDA & IBRD countries)EcuadorEgypt, Arab Rep.El SalvadorEquatorial GuineaEritreaEstoniaEthiopiaEuro areaEurope & Central AsiaEurope & Central Asia (excluding high income)Europe & Central Asia (IDA & IBRD countries)European UnionFijiFinlandFranceGabonGambia, TheGeorgiaGermanyGhanaGreeceGrenadaGuatemalaGuineaGuinea-BissauGuyanaHaitiHeavily indebted poor countries (HIPC)High incomeHondurasHong Kong SAR, ChinaHungaryIBRD onlyIcelandIDA & IBRD totalIDA blendIDA onlyIDA totalIndiaIndonesiaIran, Islamic Rep.IrelandIsraelItalyJamaicaJapanJordanKazakhstanKenyaKorea, Rep.KosovoKuwaitKyrgyz RepublicLao PDRLate-demographic dividendLatin America & Caribbean Latin America & Caribbean (excluding high income)Latin America & the Caribbean (IDA & IBRD countries)LatviaLeast developed countries: UN classificationLebanonLiberiaLibyaLithuaniaLow & middle incomeLow incomeLower middle incomeLuxembourgMacao SAR, ChinaMacedonia, FYRMadagascarMalawiMalaysiaMaliMaltaMauritaniaMauritiusMexicoMiddle East & North AfricaMiddle East & North Africa (excluding high income)Middle East & North Africa (IDA & IBRD countries)Middle incomeMoldovaMongoliaMontenegroMoroccoMozambiqueNamibiaNepalNetherlandsNew ZealandNicaraguaNigerNigeriaNorth AmericaNorwayOECD membersOmanOther small statesPakistanPanamaPapua New GuineaParaguayPeruPhilippinesPolandPortugalPost-demographic dividendPre-demographic dividendPuerto RicoQatarRomaniaRussian FederationRwandaSaudi ArabiaSenegalSerbiaSeychellesSierra LeoneSingaporeSlovak RepublicSloveniaSmall statesSolomon IslandsSouth AfricaSouth AsiaSouth Asia (IDA & IBRD)South SudanSpainSri LankaSt. Kitts and NevisSt. LuciaSt. Vincent and the GrenadinesSub-Saharan Africa Sub-Saharan Africa (excluding high income)Sub-Saharan Africa (IDA & IBRD countries)SudanSurinameSwazilandSwedenSwitzerlandSyrian Arab RepublicTajikistanTanzaniaThailandTimor-LesteTogoTongaTrinidad and TobagoTunisiaTurkeyTurkmenistanUgandaUkraineUnited Arab EmiratesUnited KingdomUnited StatesUpper middle incomeUruguayUzbekistanVanuatuVenezuela, RBVietnamWest Bank and GazaWorldYemen, Rep.ZambiaZimbabwe Timeline:
This timeline shows a graph from 1992 to 2016 of Paraguay. No data until 1991. Number of actual observations by date: 25.
Source name:
World Development Indicators
Source organization:
World Bank, International Comparison Program database.
Categories, topics:
Economy & Growth
Last updated:
apr 23, 2017
Indicators value changes by year
Minimum:
9.728 bln
jan 1, 1992
Maximum:
38.823 bln
jan 1, 2015
At the date of observation
Value
Absolute change
Change from previous value
jan 1, 1992
9.728 bln
+9.728 bln
0.0%
jan 1, 1993
10.355 bln
+627.63 mln
6.45%
jan 1, 1994
10.976 bln
+621.041 mln
6.0%
jan 1, 1995
11.535 bln
+558.772 mln
5.09%
jan 1, 1996
11.583 bln
+47.486 mln
0.41%
jan 1, 1997
12.709 bln
+1.126 bln
9.73%
jan 1, 1998
13.128 bln
+419.025 mln
3.3%
jan 1, 1999
12.809 bln
-319.572 mln
-2.43%
jan 1, 2000
13.333 bln
+524.854 mln
4.1%
jan 1, 2001
14.021 bln
+687.736 mln
5.16%
jan 1, 2002
14.765 bln
+744.147 mln
5.31%
jan 1, 2003
14.109 bln
-656.053 mln
-4.44%
jan 1, 2004
14.947 bln
+837.835 mln
5.94%
jan 1, 2005
17.42 bln
+2.473 bln
16.55%
jan 1, 2006
18.927 bln
+1.507 bln
8.65%
jan 1, 2007
20.436 bln
+1.509 bln
7.97%
jan 1, 2008
23.122 bln
+2.687 bln
13.15%
jan 1, 2009
27.3 bln
+4.178 bln
18.07%
jan 1, 2010
25.353 bln
-1.947 bln
-7.13%
jan 1, 2011
30.091 bln
+4.738 bln
18.69%
jan 1, 2012
31.93 bln
+1.838 bln
6.11%
jan 1, 2013
32.967 bln
+1.037 bln
3.25%
jan 1, 2014
35.631 bln
+2.664 bln
8.08%
jan 1, 2015
38.823 bln
+3.192 bln
8.96%
jan 1, 2016
38.657 bln
-166.483 mln
-0.43%
Ranking of countries by current statistics by years


Comments: