29
/
en
AIzaSyAYiBZKx7MnpbEhh9jyipgxe19OcubqV5w
April 1, 2024
74016
Austria
AUT
true
2
1
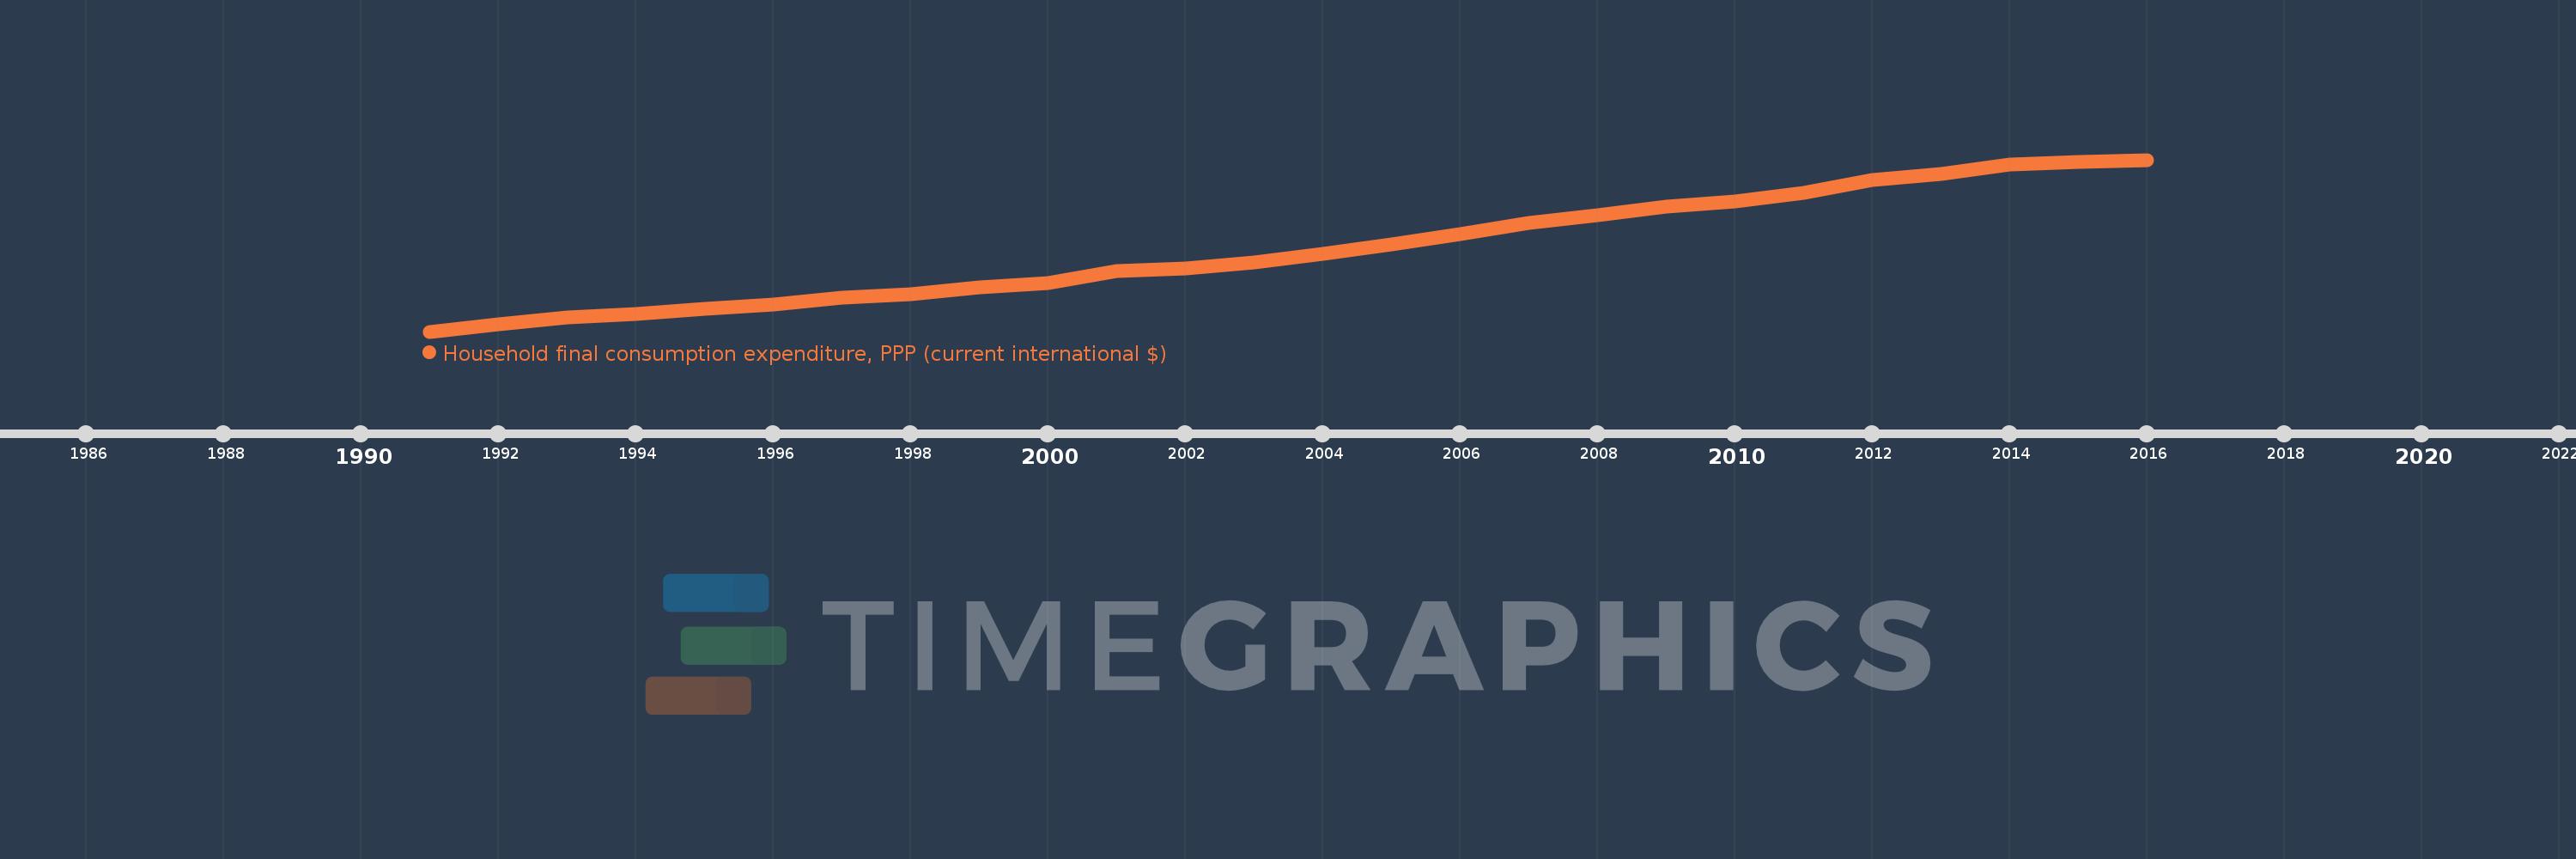
Household final consumption expenditure, PPP (current international $)
2016,2015,2014,2013,2012,2011,2010,2009,2008,2007,2006,2005,2004,2003,2002,2001,2000,1999,1998,1997,1996,1995,1994,1993,1992,1991
This statistics in other country:
AfghanistanAlbaniaAlgeriaAngolaAntigua and BarbudaArab WorldArgentinaArmeniaArubaAustraliaAustriaAzerbaijanBahamas, TheBahrainBangladeshBarbadosBelarusBelgiumBelizeBeninBermudaBhutanBoliviaBosnia and HerzegovinaBotswanaBrazilBrunei DarussalamBulgariaBurkina FasoBurundiCabo VerdeCambodiaCameroonCanadaCaribbean small statesCentral African RepublicCentral Europe and the BalticsChadChileChinaColombiaComorosCongo, Dem. Rep.Congo, Rep.Costa RicaCote d'IvoireCroatiaCubaCyprusCzech RepublicDenmarkDjiboutiDominicaDominican RepublicEarly-demographic dividendEast Asia & PacificEast Asia & Pacific (excluding high income)East Asia & Pacific (IDA & IBRD countries)EcuadorEgypt, Arab Rep.El SalvadorEquatorial GuineaEritreaEstoniaEthiopiaEuro areaEurope & Central AsiaEurope & Central Asia (excluding high income)Europe & Central Asia (IDA & IBRD countries)European UnionFijiFinlandFranceGabonGambia, TheGeorgiaGermanyGhanaGreeceGrenadaGuatemalaGuineaGuinea-BissauGuyanaHaitiHeavily indebted poor countries (HIPC)High incomeHondurasHong Kong SAR, ChinaHungaryIBRD onlyIcelandIDA & IBRD totalIDA blendIDA onlyIDA totalIndiaIndonesiaIran, Islamic Rep.IrelandIsraelItalyJamaicaJapanJordanKazakhstanKenyaKorea, Rep.KosovoKuwaitKyrgyz RepublicLao PDRLate-demographic dividendLatin America & Caribbean Latin America & Caribbean (excluding high income)Latin America & the Caribbean (IDA & IBRD countries)LatviaLeast developed countries: UN classificationLebanonLiberiaLibyaLithuaniaLow & middle incomeLow incomeLower middle incomeLuxembourgMacao SAR, ChinaMacedonia, FYRMadagascarMalawiMalaysiaMaliMaltaMauritaniaMauritiusMexicoMiddle East & North AfricaMiddle East & North Africa (excluding high income)Middle East & North Africa (IDA & IBRD countries)Middle incomeMoldovaMongoliaMontenegroMoroccoMozambiqueNamibiaNepalNetherlandsNew ZealandNicaraguaNigerNigeriaNorth AmericaNorwayOECD membersOmanOther small statesPakistanPanamaPapua New GuineaParaguayPeruPhilippinesPolandPortugalPost-demographic dividendPre-demographic dividendPuerto RicoQatarRomaniaRussian FederationRwandaSaudi ArabiaSenegalSerbiaSeychellesSierra LeoneSingaporeSlovak RepublicSloveniaSmall statesSolomon IslandsSouth AfricaSouth AsiaSouth Asia (IDA & IBRD)South SudanSpainSri LankaSt. Kitts and NevisSt. LuciaSt. Vincent and the GrenadinesSub-Saharan Africa Sub-Saharan Africa (excluding high income)Sub-Saharan Africa (IDA & IBRD countries)SudanSurinameSwazilandSwedenSwitzerlandSyrian Arab RepublicTajikistanTanzaniaThailandTimor-LesteTogoTongaTrinidad and TobagoTunisiaTurkeyTurkmenistanUgandaUkraineUnited Arab EmiratesUnited KingdomUnited StatesUpper middle incomeUruguayUzbekistanVanuatuVenezuela, RBVietnamWest Bank and GazaWorldYemen, Rep.ZambiaZimbabwe Timeline:
This timeline shows a graph from 1991 to 2016 of Austria. No data until 1990. Number of actual observations by date: 26.
Source name:
World Development Indicators
Source organization:
World Bank, International Comparison Program database.
Categories, topics:
Economy & Growth
Last updated:
apr 23, 2017
Indicators value changes by year
Minimum:
82.03 bln
jan 1, 1991
Maximum:
209.189 bln
jan 1, 2016
At the date of observation
Value
Absolute change
Change from previous value
jan 1, 1991
82.03 bln
+82.03 bln
0.0%
jan 1, 1992
87.258 bln
+5.228 bln
6.37%
jan 1, 1993
92.681 bln
+5.423 bln
6.22%
jan 1, 1994
95.096 bln
+2.414 bln
2.61%
jan 1, 1995
99.057 bln
+3.961 bln
4.17%
jan 1, 1996
101.975 bln
+2.918 bln
2.95%
jan 1, 1997
107.169 bln
+5.193 bln
5.09%
jan 1, 1998
109.513 bln
+2.344 bln
2.19%
jan 1, 1999
114.48 bln
+4.967 bln
4.54%
jan 1, 2000
117.849 bln
+3.369 bln
2.94%
jan 1, 2001
126.564 bln
+8.715 bln
7.39%
jan 1, 2002
128.93 bln
+2.367 bln
1.87%
jan 1, 2003
133.243 bln
+4.313 bln
3.34%
jan 1, 2004
139.555 bln
+6.312 bln
4.74%
jan 1, 2005
146.249 bln
+6.695 bln
4.8%
jan 1, 2006
154.213 bln
+7.964 bln
5.45%
jan 1, 2007
162.387 bln
+8.174 bln
5.3%
jan 1, 2008
168.031 bln
+5.644 bln
3.48%
jan 1, 2009
174.602 bln
+6.571 bln
3.91%
jan 1, 2010
178.458 bln
+3.857 bln
2.21%
jan 1, 2011
184.434 bln
+5.976 bln
3.35%
jan 1, 2012
194.15 bln
+9.716 bln
5.27%
jan 1, 2013
198.718 bln
+4.568 bln
2.35%
jan 1, 2014
205.378 bln
+6.66 bln
3.35%
jan 1, 2015
207.887 bln
+2.51 bln
1.22%
jan 1, 2016
209.189 bln
+1.302 bln
0.63%
Ranking of countries by current statistics by years


Comments: