29
/
en
AIzaSyAYiBZKx7MnpbEhh9jyipgxe19OcubqV5w
April 1, 2024
171805
Kuwait
KWT
true
2
1
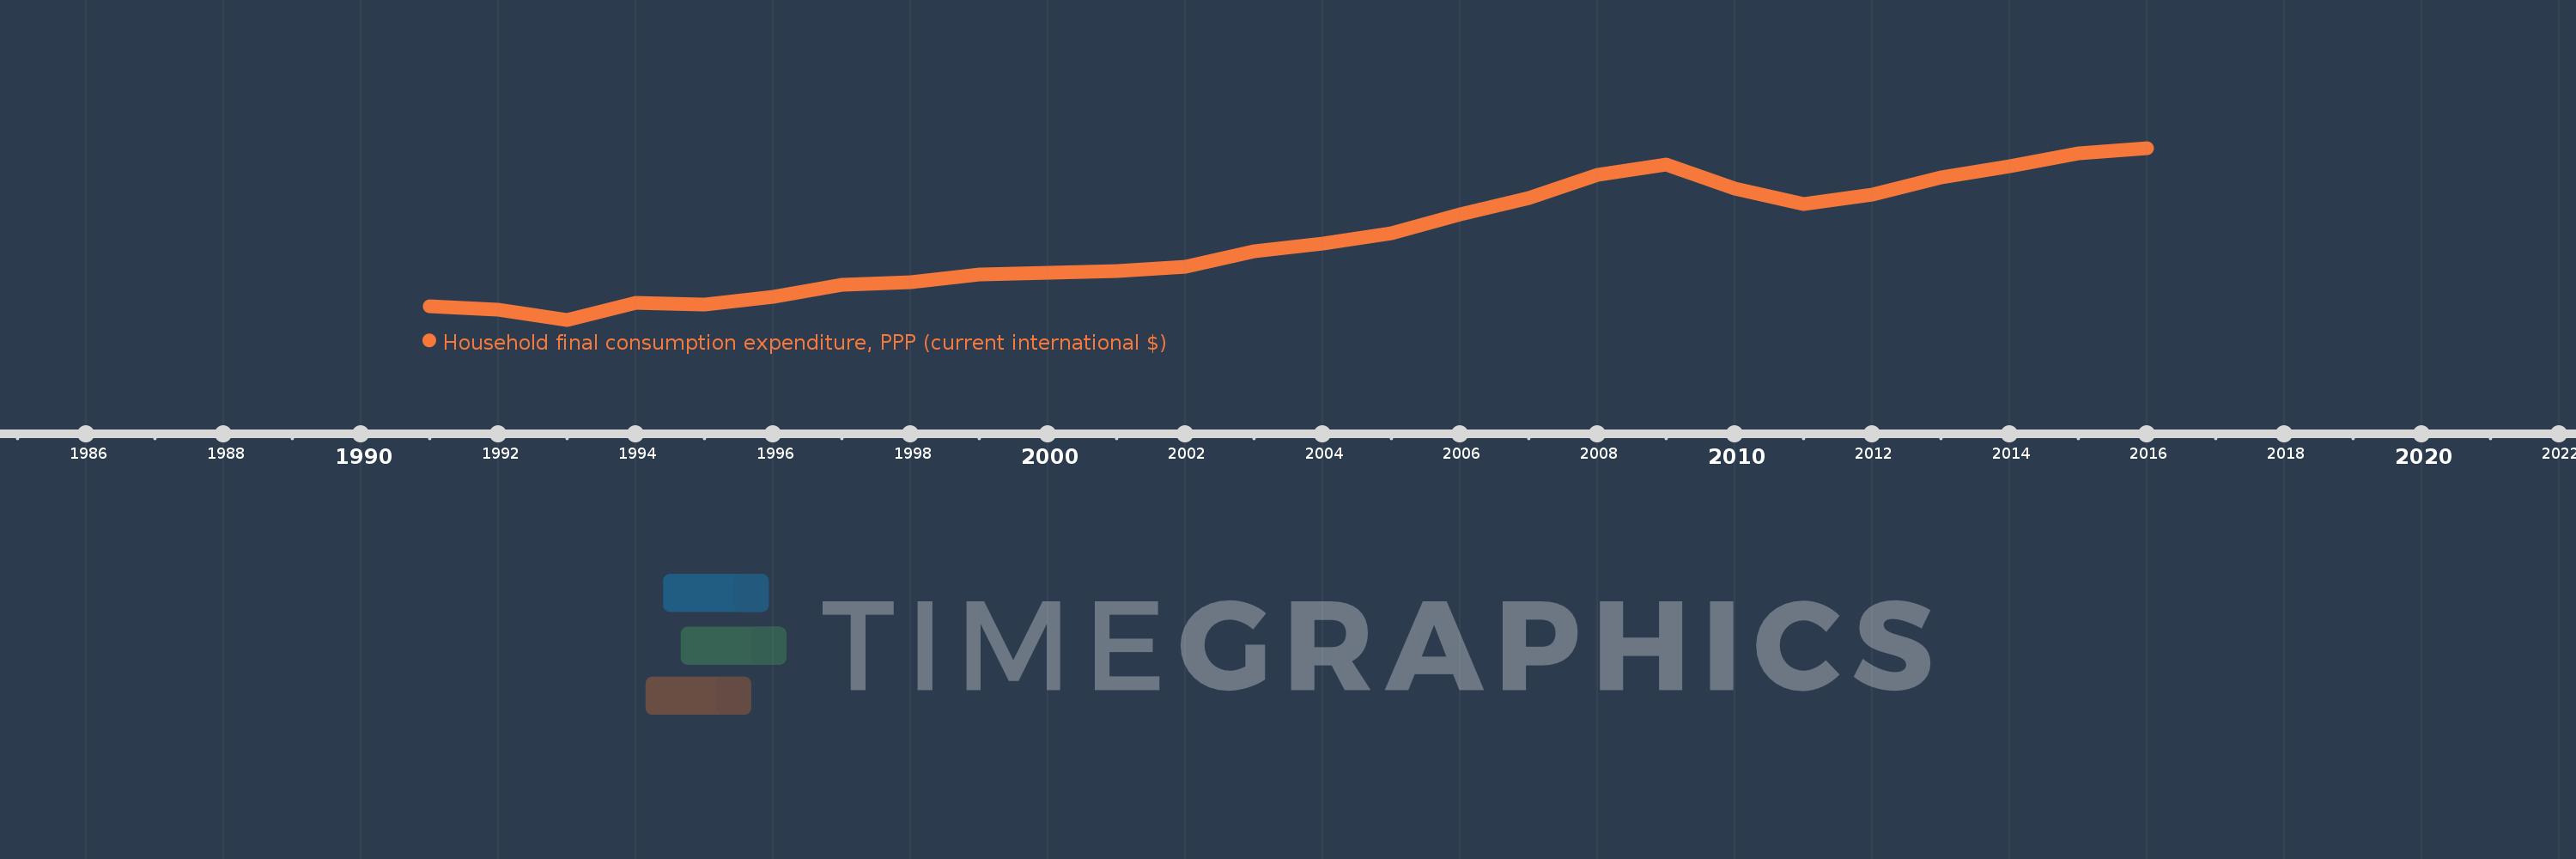
Household final consumption expenditure, PPP (current international $)
2016,2015,2014,2013,2012,2011,2010,2009,2008,2007,2006,2005,2004,2003,2002,2001,2000,1999,1998,1997,1996,1995,1994,1993,1992,1991
This statistics in other country:
AfghanistanAlbaniaAlgeriaAngolaAntigua and BarbudaArab WorldArgentinaArmeniaArubaAustraliaAustriaAzerbaijanBahamas, TheBahrainBangladeshBarbadosBelarusBelgiumBelizeBeninBermudaBhutanBoliviaBosnia and HerzegovinaBotswanaBrazilBrunei DarussalamBulgariaBurkina FasoBurundiCabo VerdeCambodiaCameroonCanadaCaribbean small statesCentral African RepublicCentral Europe and the BalticsChadChileChinaColombiaComorosCongo, Dem. Rep.Congo, Rep.Costa RicaCote d'IvoireCroatiaCubaCyprusCzech RepublicDenmarkDjiboutiDominicaDominican RepublicEarly-demographic dividendEast Asia & PacificEast Asia & Pacific (excluding high income)East Asia & Pacific (IDA & IBRD countries)EcuadorEgypt, Arab Rep.El SalvadorEquatorial GuineaEritreaEstoniaEthiopiaEuro areaEurope & Central AsiaEurope & Central Asia (excluding high income)Europe & Central Asia (IDA & IBRD countries)European UnionFijiFinlandFranceGabonGambia, TheGeorgiaGermanyGhanaGreeceGrenadaGuatemalaGuineaGuinea-BissauGuyanaHaitiHeavily indebted poor countries (HIPC)High incomeHondurasHong Kong SAR, ChinaHungaryIBRD onlyIcelandIDA & IBRD totalIDA blendIDA onlyIDA totalIndiaIndonesiaIran, Islamic Rep.IrelandIsraelItalyJamaicaJapanJordanKazakhstanKenyaKorea, Rep.KosovoKuwaitKyrgyz RepublicLao PDRLate-demographic dividendLatin America & Caribbean Latin America & Caribbean (excluding high income)Latin America & the Caribbean (IDA & IBRD countries)LatviaLeast developed countries: UN classificationLebanonLiberiaLibyaLithuaniaLow & middle incomeLow incomeLower middle incomeLuxembourgMacao SAR, ChinaMacedonia, FYRMadagascarMalawiMalaysiaMaliMaltaMauritaniaMauritiusMexicoMiddle East & North AfricaMiddle East & North Africa (excluding high income)Middle East & North Africa (IDA & IBRD countries)Middle incomeMoldovaMongoliaMontenegroMoroccoMozambiqueNamibiaNepalNetherlandsNew ZealandNicaraguaNigerNigeriaNorth AmericaNorwayOECD membersOmanOther small statesPakistanPanamaPapua New GuineaParaguayPeruPhilippinesPolandPortugalPost-demographic dividendPre-demographic dividendPuerto RicoQatarRomaniaRussian FederationRwandaSaudi ArabiaSenegalSerbiaSeychellesSierra LeoneSingaporeSlovak RepublicSloveniaSmall statesSolomon IslandsSouth AfricaSouth AsiaSouth Asia (IDA & IBRD)South SudanSpainSri LankaSt. Kitts and NevisSt. LuciaSt. Vincent and the GrenadinesSub-Saharan Africa Sub-Saharan Africa (excluding high income)Sub-Saharan Africa (IDA & IBRD countries)SudanSurinameSwazilandSwedenSwitzerlandSyrian Arab RepublicTajikistanTanzaniaThailandTimor-LesteTogoTongaTrinidad and TobagoTunisiaTurkeyTurkmenistanUgandaUkraineUnited Arab EmiratesUnited KingdomUnited StatesUpper middle incomeUruguayUzbekistanVanuatuVenezuela, RBVietnamWest Bank and GazaWorldYemen, Rep.ZambiaZimbabwe Timeline:
This timeline shows a graph from 1991 to 2016 of Kuwait. No data until 1990. Number of actual observations by date: 26.
Source name:
World Development Indicators
Source organization:
World Bank, International Comparison Program database.
Categories, topics:
Economy & Growth
Last updated:
apr 23, 2017
Indicators value changes by year
Minimum:
13.398 bln
jan 1, 1993
Maximum:
73.509 bln
jan 1, 2016
At the date of observation
Value
Absolute change
Change from previous value
jan 1, 1991
18.252 bln
+18.252 bln
0.0%
jan 1, 1992
16.858 bln
-1.393 bln
-7.63%
jan 1, 1993
13.398 bln
-3.46 bln
-20.53%
jan 1, 1994
19.336 bln
+5.938 bln
44.32%
jan 1, 1995
18.81 bln
-525.596 mln
-2.72%
jan 1, 1996
21.341 bln
+2.531 bln
13.45%
jan 1, 1997
25.73 bln
+4.389 bln
20.57%
jan 1, 1998
26.646 bln
+916.322 mln
3.56%
jan 1, 1999
29.107 bln
+2.46 bln
9.23%
jan 1, 2000
29.926 bln
+819.74 mln
2.82%
jan 1, 2001
30.576 bln
+649.954 mln
2.17%
jan 1, 2002
31.999 bln
+1.423 bln
4.65%
jan 1, 2003
37.385 bln
+5.385 bln
16.83%
jan 1, 2004
40.175 bln
+2.791 bln
7.46%
jan 1, 2005
43.796 bln
+3.62 bln
9.01%
jan 1, 2006
50.312 bln
+6.517 bln
14.88%
jan 1, 2007
55.936 bln
+5.624 bln
11.18%
jan 1, 2008
64.251 bln
+8.315 bln
14.87%
jan 1, 2009
67.815 bln
+3.564 bln
5.55%
jan 1, 2010
59.195 bln
-8.62 bln
-12.71%
jan 1, 2011
53.865 bln
-5.331 bln
-9.0%
jan 1, 2012
57.136 bln
+3.272 bln
6.07%
jan 1, 2013
63.169 bln
+6.033 bln
10.56%
jan 1, 2014
67.257 bln
+4.088 bln
6.47%
jan 1, 2015
71.733 bln
+4.476 bln
6.66%
jan 1, 2016
73.509 bln
+1.776 bln
2.48%
Ranking of countries by current statistics by years


Comments: