29
/
en
AIzaSyAYiBZKx7MnpbEhh9jyipgxe19OcubqV5w
April 1, 2024
224955
Poland
POL
true
2
1
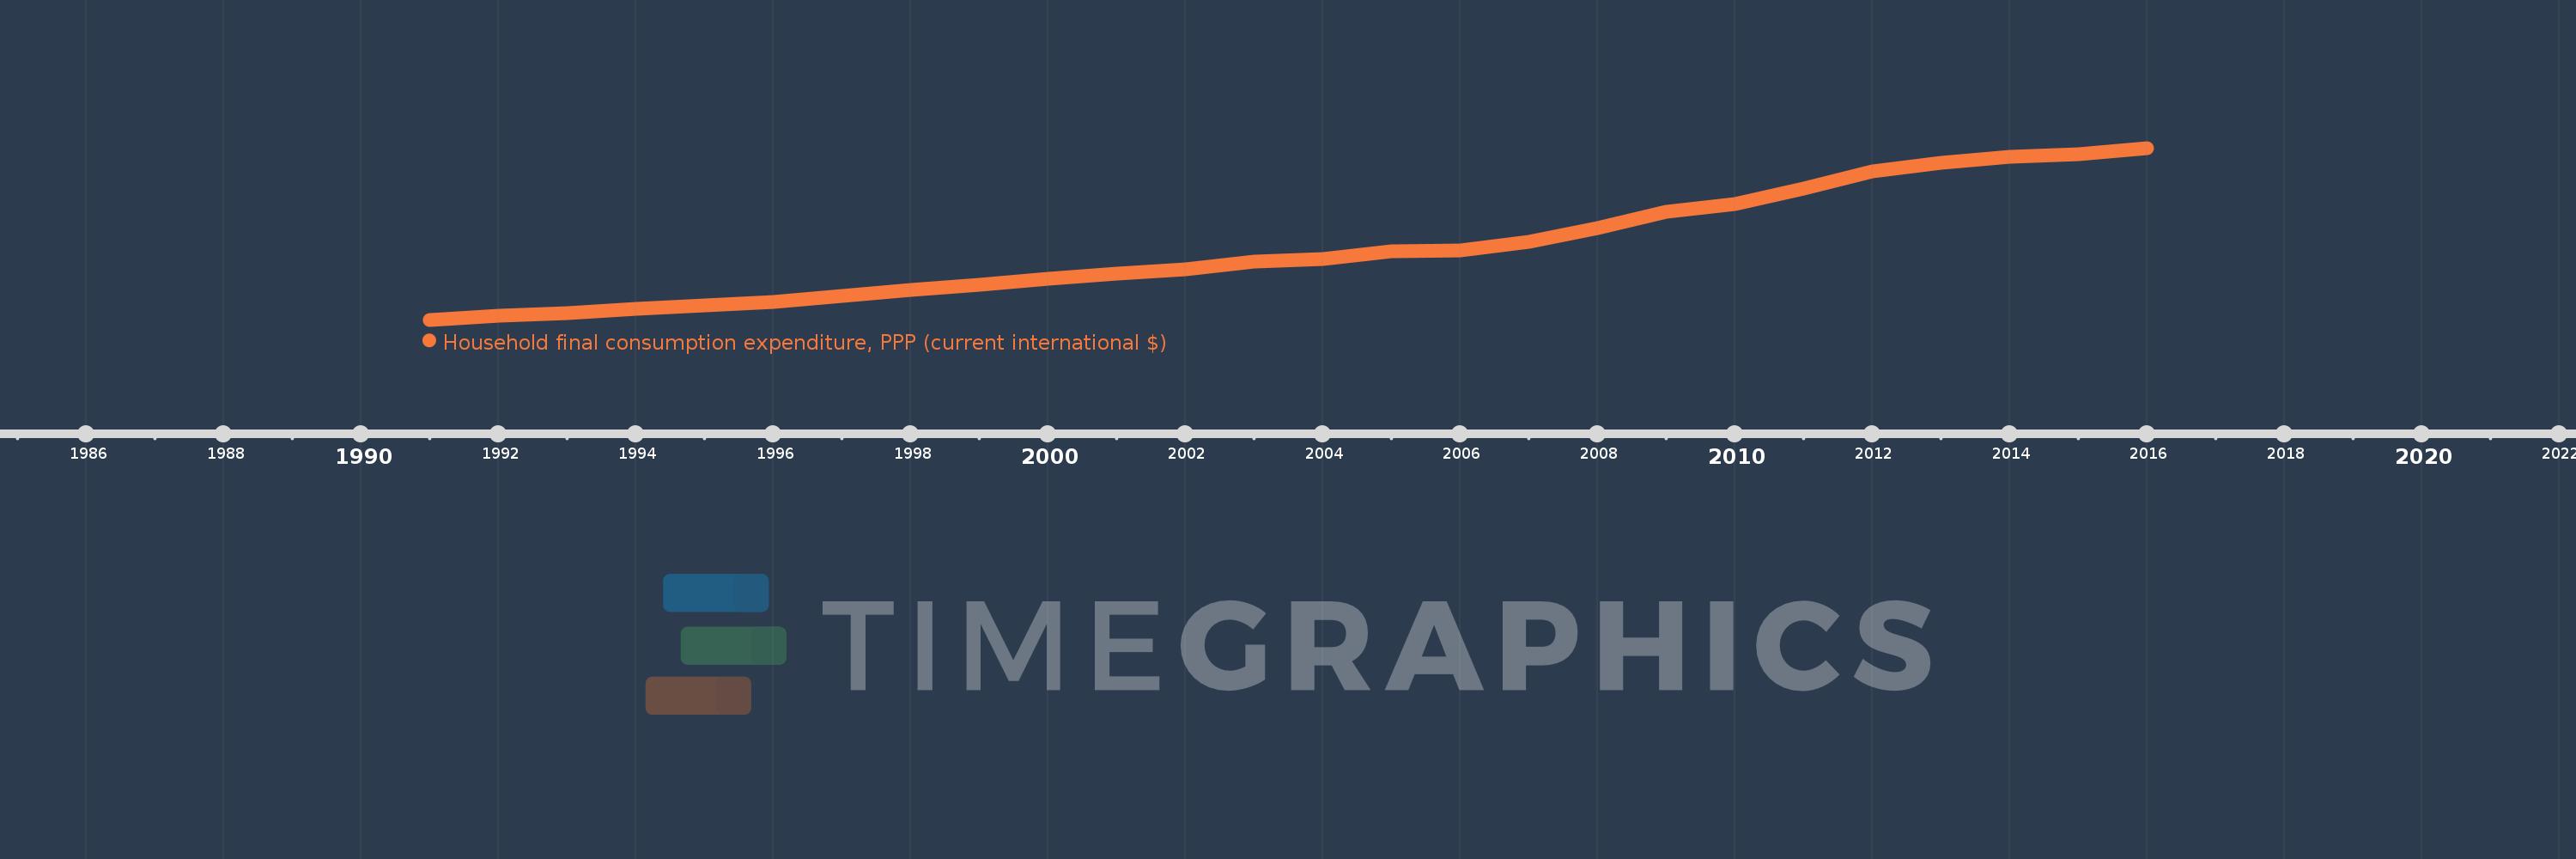
Household final consumption expenditure, PPP (current international $)
2016,2015,2014,2013,2012,2011,2010,2009,2008,2007,2006,2005,2004,2003,2002,2001,2000,1999,1998,1997,1996,1995,1994,1993,1992,1991
This statistics in other country:
AfghanistanAlbaniaAlgeriaAngolaAntigua and BarbudaArab WorldArgentinaArmeniaArubaAustraliaAustriaAzerbaijanBahamas, TheBahrainBangladeshBarbadosBelarusBelgiumBelizeBeninBermudaBhutanBoliviaBosnia and HerzegovinaBotswanaBrazilBrunei DarussalamBulgariaBurkina FasoBurundiCabo VerdeCambodiaCameroonCanadaCaribbean small statesCentral African RepublicCentral Europe and the BalticsChadChileChinaColombiaComorosCongo, Dem. Rep.Congo, Rep.Costa RicaCote d'IvoireCroatiaCubaCyprusCzech RepublicDenmarkDjiboutiDominicaDominican RepublicEarly-demographic dividendEast Asia & PacificEast Asia & Pacific (excluding high income)East Asia & Pacific (IDA & IBRD countries)EcuadorEgypt, Arab Rep.El SalvadorEquatorial GuineaEritreaEstoniaEthiopiaEuro areaEurope & Central AsiaEurope & Central Asia (excluding high income)Europe & Central Asia (IDA & IBRD countries)European UnionFijiFinlandFranceGabonGambia, TheGeorgiaGermanyGhanaGreeceGrenadaGuatemalaGuineaGuinea-BissauGuyanaHaitiHeavily indebted poor countries (HIPC)High incomeHondurasHong Kong SAR, ChinaHungaryIBRD onlyIcelandIDA & IBRD totalIDA blendIDA onlyIDA totalIndiaIndonesiaIran, Islamic Rep.IrelandIsraelItalyJamaicaJapanJordanKazakhstanKenyaKorea, Rep.KosovoKuwaitKyrgyz RepublicLao PDRLate-demographic dividendLatin America & Caribbean Latin America & Caribbean (excluding high income)Latin America & the Caribbean (IDA & IBRD countries)LatviaLeast developed countries: UN classificationLebanonLiberiaLibyaLithuaniaLow & middle incomeLow incomeLower middle incomeLuxembourgMacao SAR, ChinaMacedonia, FYRMadagascarMalawiMalaysiaMaliMaltaMauritaniaMauritiusMexicoMiddle East & North AfricaMiddle East & North Africa (excluding high income)Middle East & North Africa (IDA & IBRD countries)Middle incomeMoldovaMongoliaMontenegroMoroccoMozambiqueNamibiaNepalNetherlandsNew ZealandNicaraguaNigerNigeriaNorth AmericaNorwayOECD membersOmanOther small statesPakistanPanamaPapua New GuineaParaguayPeruPhilippinesPolandPortugalPost-demographic dividendPre-demographic dividendPuerto RicoQatarRomaniaRussian FederationRwandaSaudi ArabiaSenegalSerbiaSeychellesSierra LeoneSingaporeSlovak RepublicSloveniaSmall statesSolomon IslandsSouth AfricaSouth AsiaSouth Asia (IDA & IBRD)South SudanSpainSri LankaSt. Kitts and NevisSt. LuciaSt. Vincent and the GrenadinesSub-Saharan Africa Sub-Saharan Africa (excluding high income)Sub-Saharan Africa (IDA & IBRD countries)SudanSurinameSwazilandSwedenSwitzerlandSyrian Arab RepublicTajikistanTanzaniaThailandTimor-LesteTogoTongaTrinidad and TobagoTunisiaTurkeyTurkmenistanUgandaUkraineUnited Arab EmiratesUnited KingdomUnited StatesUpper middle incomeUruguayUzbekistanVanuatuVenezuela, RBVietnamWest Bank and GazaWorldYemen, Rep.ZambiaZimbabwe Timeline:
This timeline shows a graph from 1991 to 2016 of Poland. No data until 1990. Number of actual observations by date: 26.
Source name:
World Development Indicators
Source organization:
World Bank, International Comparison Program database.
Categories, topics:
Economy & Growth
Last updated:
apr 23, 2017
Indicators value changes by year
Minimum:
113.198 bln
jan 1, 1991
Maximum:
563.887 bln
jan 1, 2016
At the date of observation
Value
Absolute change
Change from previous value
jan 1, 1991
113.198 bln
+113.198 bln
0.0%
jan 1, 1992
124.648 bln
+11.45 bln
10.12%
jan 1, 1993
130.982 bln
+6.334 bln
5.08%
jan 1, 1994
141.449 bln
+10.467 bln
7.99%
jan 1, 1995
150.877 bln
+9.429 bln
6.67%
jan 1, 1996
158.888 bln
+8.011 bln
5.31%
jan 1, 1997
176.144 bln
+17.256 bln
10.86%
jan 1, 1998
192.324 bln
+16.18 bln
9.19%
jan 1, 1999
204.448 bln
+12.124 bln
6.3%
jan 1, 2000
219.828 bln
+15.38 bln
7.52%
jan 1, 2001
234.46 bln
+14.632 bln
6.66%
jan 1, 2002
245.301 bln
+10.841 bln
4.62%
jan 1, 2003
265.199 bln
+19.898 bln
8.11%
jan 1, 2004
272.58 bln
+7.38 bln
2.78%
jan 1, 2005
292.687 bln
+20.107 bln
7.38%
jan 1, 2006
293.998 bln
+1.311 bln
0.45%
jan 1, 2007
316.654 bln
+22.656 bln
7.71%
jan 1, 2008
352.824 bln
+36.17 bln
11.42%
jan 1, 2009
396.112 bln
+43.288 bln
12.27%
jan 1, 2010
417.492 bln
+21.38 bln
5.4%
jan 1, 2011
456.297 bln
+38.805 bln
9.29%
jan 1, 2012
501.536 bln
+45.239 bln
9.91%
jan 1, 2013
525.392 bln
+23.857 bln
4.76%
jan 1, 2014
539.592 bln
+14.2 bln
2.7%
jan 1, 2015
546.93 bln
+7.337 bln
1.36%
jan 1, 2016
563.887 bln
+16.957 bln
3.1%
Ranking of countries by current statistics by years


Comments: