29
/
en
AIzaSyAYiBZKx7MnpbEhh9jyipgxe19OcubqV5w
April 1, 2024
133250
Finland
FIN
true
2
1
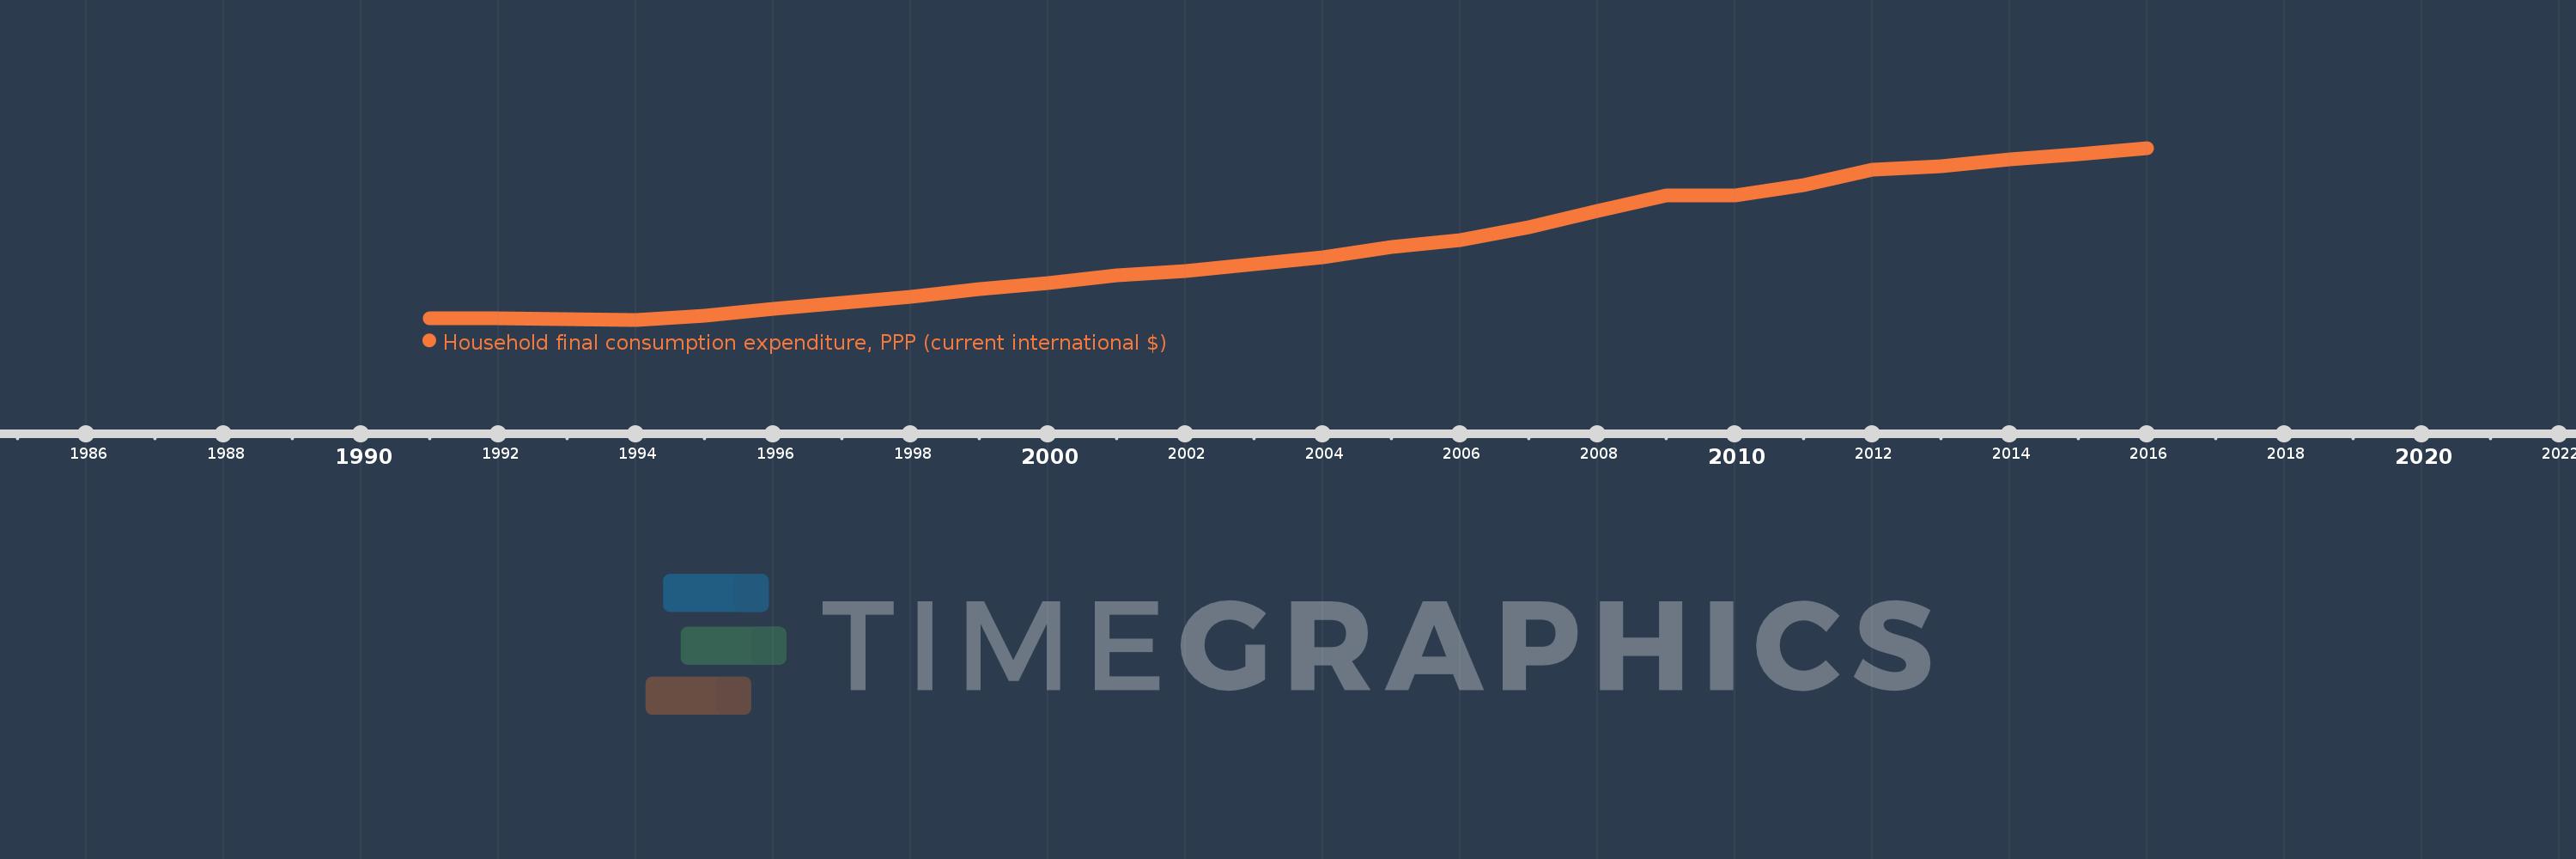
Household final consumption expenditure, PPP (current international $)
2016,2015,2014,2013,2012,2011,2010,2009,2008,2007,2006,2005,2004,2003,2002,2001,2000,1999,1998,1997,1996,1995,1994,1993,1992,1991
This statistics in other country:
AfghanistanAlbaniaAlgeriaAngolaAntigua and BarbudaArab WorldArgentinaArmeniaArubaAustraliaAustriaAzerbaijanBahamas, TheBahrainBangladeshBarbadosBelarusBelgiumBelizeBeninBermudaBhutanBoliviaBosnia and HerzegovinaBotswanaBrazilBrunei DarussalamBulgariaBurkina FasoBurundiCabo VerdeCambodiaCameroonCanadaCaribbean small statesCentral African RepublicCentral Europe and the BalticsChadChileChinaColombiaComorosCongo, Dem. Rep.Congo, Rep.Costa RicaCote d'IvoireCroatiaCubaCyprusCzech RepublicDenmarkDjiboutiDominicaDominican RepublicEarly-demographic dividendEast Asia & PacificEast Asia & Pacific (excluding high income)East Asia & Pacific (IDA & IBRD countries)EcuadorEgypt, Arab Rep.El SalvadorEquatorial GuineaEritreaEstoniaEthiopiaEuro areaEurope & Central AsiaEurope & Central Asia (excluding high income)Europe & Central Asia (IDA & IBRD countries)European UnionFijiFinlandFranceGabonGambia, TheGeorgiaGermanyGhanaGreeceGrenadaGuatemalaGuineaGuinea-BissauGuyanaHaitiHeavily indebted poor countries (HIPC)High incomeHondurasHong Kong SAR, ChinaHungaryIBRD onlyIcelandIDA & IBRD totalIDA blendIDA onlyIDA totalIndiaIndonesiaIran, Islamic Rep.IrelandIsraelItalyJamaicaJapanJordanKazakhstanKenyaKorea, Rep.KosovoKuwaitKyrgyz RepublicLao PDRLate-demographic dividendLatin America & Caribbean Latin America & Caribbean (excluding high income)Latin America & the Caribbean (IDA & IBRD countries)LatviaLeast developed countries: UN classificationLebanonLiberiaLibyaLithuaniaLow & middle incomeLow incomeLower middle incomeLuxembourgMacao SAR, ChinaMacedonia, FYRMadagascarMalawiMalaysiaMaliMaltaMauritaniaMauritiusMexicoMiddle East & North AfricaMiddle East & North Africa (excluding high income)Middle East & North Africa (IDA & IBRD countries)Middle incomeMoldovaMongoliaMontenegroMoroccoMozambiqueNamibiaNepalNetherlandsNew ZealandNicaraguaNigerNigeriaNorth AmericaNorwayOECD membersOmanOther small statesPakistanPanamaPapua New GuineaParaguayPeruPhilippinesPolandPortugalPost-demographic dividendPre-demographic dividendPuerto RicoQatarRomaniaRussian FederationRwandaSaudi ArabiaSenegalSerbiaSeychellesSierra LeoneSingaporeSlovak RepublicSloveniaSmall statesSolomon IslandsSouth AfricaSouth AsiaSouth Asia (IDA & IBRD)South SudanSpainSri LankaSt. Kitts and NevisSt. LuciaSt. Vincent and the GrenadinesSub-Saharan Africa Sub-Saharan Africa (excluding high income)Sub-Saharan Africa (IDA & IBRD countries)SudanSurinameSwazilandSwedenSwitzerlandSyrian Arab RepublicTajikistanTanzaniaThailandTimor-LesteTogoTongaTrinidad and TobagoTunisiaTurkeyTurkmenistanUgandaUkraineUnited Arab EmiratesUnited KingdomUnited StatesUpper middle incomeUruguayUzbekistanVanuatuVenezuela, RBVietnamWest Bank and GazaWorldYemen, Rep.ZambiaZimbabwe Timeline:
This timeline shows a graph from 1991 to 2016 of Finland. No data until 1990. Number of actual observations by date: 26.
Source name:
World Development Indicators
Source organization:
World Bank, International Comparison Program database.
Categories, topics:
Economy & Growth
Last updated:
apr 23, 2017
Indicators value changes by year
Minimum:
40.841 bln
jan 1, 1994
Maximum:
118.285 bln
jan 1, 2016
At the date of observation
Value
Absolute change
Change from previous value
jan 1, 1991
41.622 bln
+41.622 bln
0.0%
jan 1, 1992
41.635 bln
+12.702 mln
0.03%
jan 1, 1993
40.929 bln
-705.764 mln
-1.7%
jan 1, 1994
40.841 bln
-87.68 mln
-0.21%
jan 1, 1995
42.788 bln
+1.947 bln
4.77%
jan 1, 1996
45.853 bln
+3.066 bln
7.16%
jan 1, 1997
48.403 bln
+2.55 bln
5.56%
jan 1, 1998
51.243 bln
+2.84 bln
5.87%
jan 1, 1999
54.482 bln
+3.239 bln
6.32%
jan 1, 2000
57.362 bln
+2.879 bln
5.29%
jan 1, 2001
60.723 bln
+3.361 bln
5.86%
jan 1, 2002
62.78 bln
+2.057 bln
3.39%
jan 1, 2003
65.779 bln
+2.999 bln
4.78%
jan 1, 2004
68.962 bln
+3.183 bln
4.84%
jan 1, 2005
73.804 bln
+4.842 bln
7.02%
jan 1, 2006
76.662 bln
+2.859 bln
3.87%
jan 1, 2007
82.593 bln
+5.931 bln
7.74%
jan 1, 2008
89.906 bln
+7.313 bln
8.85%
jan 1, 2009
96.85 bln
+6.944 bln
7.72%
jan 1, 2010
96.805 bln
-45.473 mln
-0.05%
jan 1, 2011
101.683 bln
+4.878 bln
5.04%
jan 1, 2012
108.606 bln
+6.923 bln
6.81%
jan 1, 2013
110.168 bln
+1.562 bln
1.44%
jan 1, 2014
113.316 bln
+3.148 bln
2.86%
jan 1, 2015
115.612 bln
+2.296 bln
2.03%
jan 1, 2016
118.285 bln
+2.673 bln
2.31%
Ranking of countries by current statistics by years


Comments: